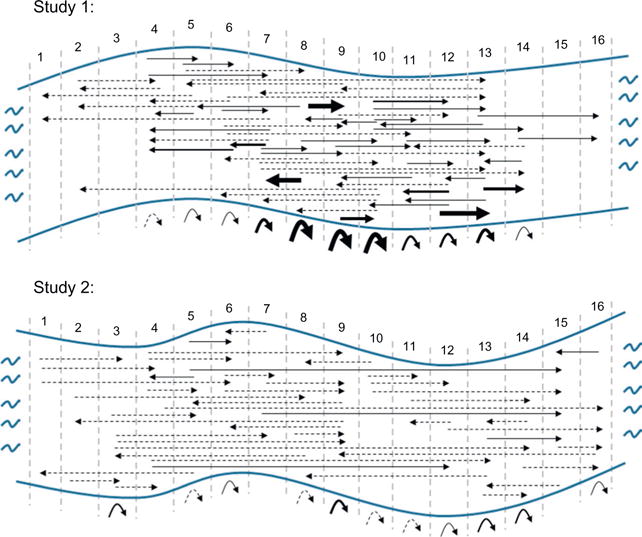
Figure 1.

Stickleback movement in the stream in both studies. Shown is the study section of river divided into 15 m transects (vertical grey dashed lines) with a riffle at either end. Transect number is above the river. The direction of the arrowed line indicates the direction in which the fish moved between initial and subsequent captures. The thickness of the arrowed lines indicates the number of individuals that moved between those two transects (dashed line = 1 individual). The curved arrows below the river indicate the number of individuals that were recaptured within that same transect.
