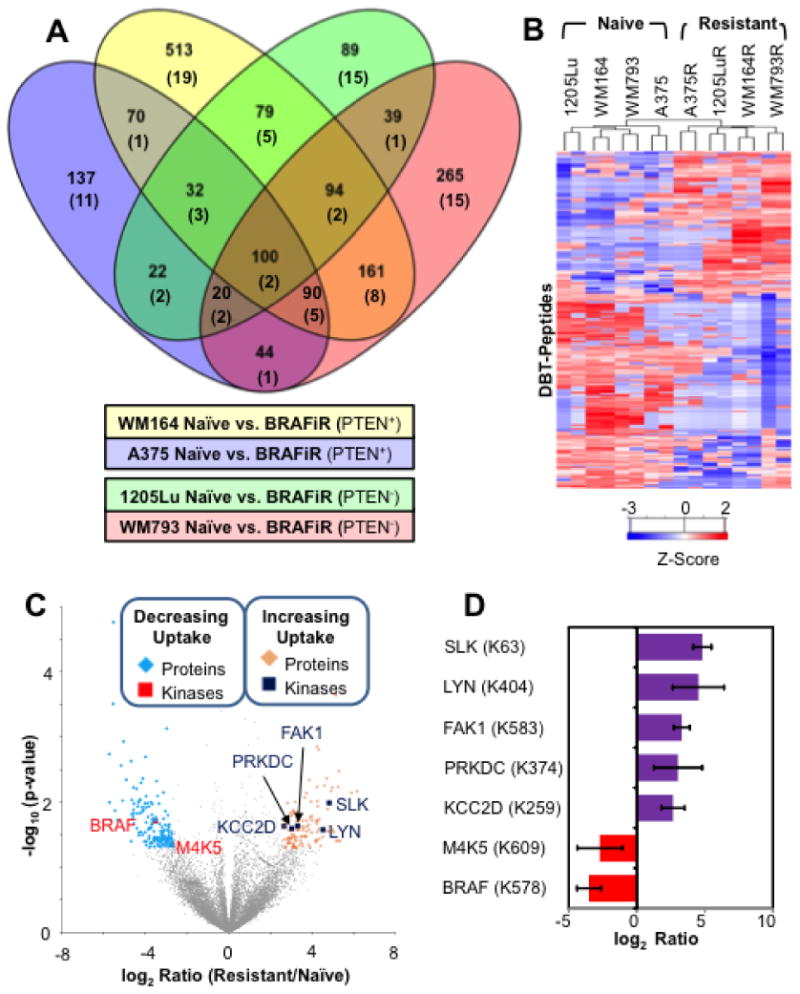
Figure 1. Common Changes in ATP Probe Uptake across 4 Model Systems of BRAFi Resistance.

(A) Venn diagram showing overlap between the four isogenic naïve/BRAFi resistant cell line pairs in proteins with differential ATP probe uptake based on detection of DBT-peptides selected using p < 0.05; numbers of protein kinases with differential ion signals for DBT-peptides are given in parentheses. See Supplementary Figure S1 for additional details. (B) Heat map of desthiobiotinylated (DBT) peptides with consistently observed significant differences in ion signal (log2 ratio exceed 2 standard deviation away from the mean and p-value < 0.05) between naïve and BRAFi resistant cells produced by unsupervised clustering. (C) Volcano plot of ratios and p values for DBT-peptides indicating proteins (blue diamonds) and kinases (red squares) with decreasing ATP probe binding as well as proteins (gold diamonds) and kinases (blue squares) with increasing ATP probe binding in BRAFi resistant cell line. (D) Bar graph showing log ratio of the kinases (annotated with DBT-site) marked in the volcano-plot. Error bars represent standard deviation in BRAFi resistant to naïve ratio calculated for each set of replicate measurements.
