
Figure 3. Mapping ABPP Data to the Kinome Tree for Four Cell Line Models of BRAFi Resistance.
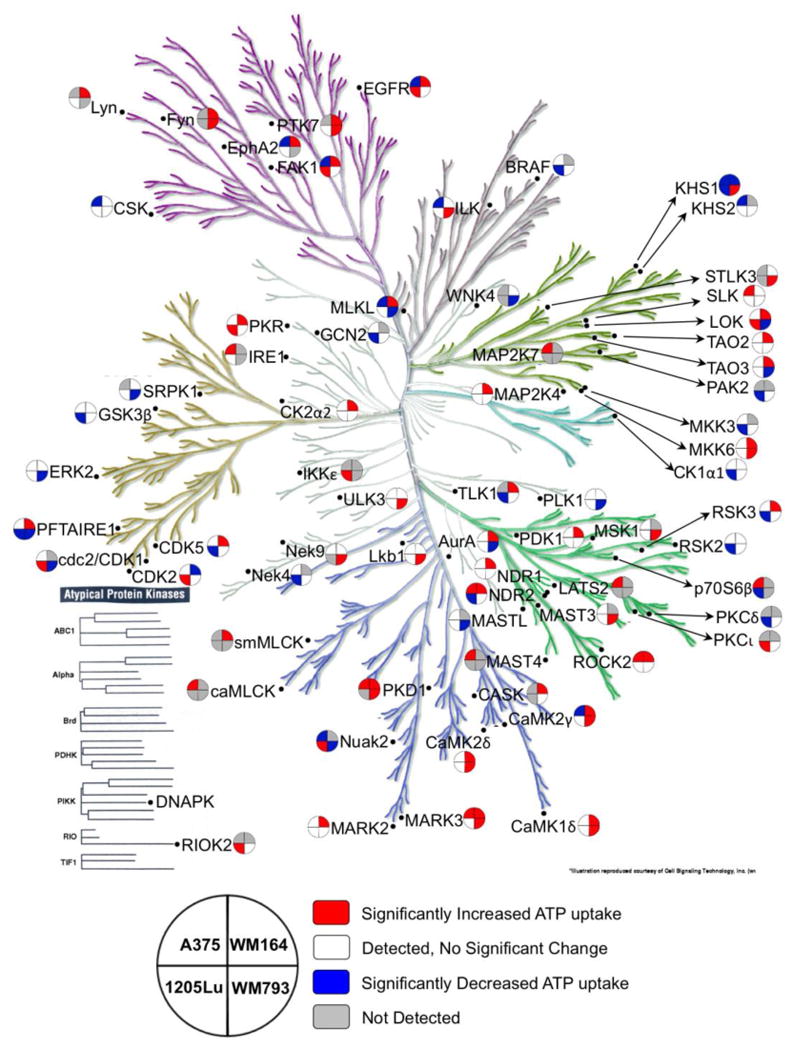
To provide an overview of the diverse signaling events associated with BRAFi resistance, selected kinase peptide-level data (DBT peptide with p < 0.05 in at least one naïve/BRAFi resistant cell line pair) is mapped onto the kinome tree. The key describes the layout of cell lines; the color coding includes DBT peptide not detected (gray), DBT peptide detected but not significantly changed (white), significantly increased (red), and significantly decreased in the drug resistance (blue). The kinome tree is used with permission from Cell Signaling Technology (Manning G et. al. Science 2002).55