Figure 2.

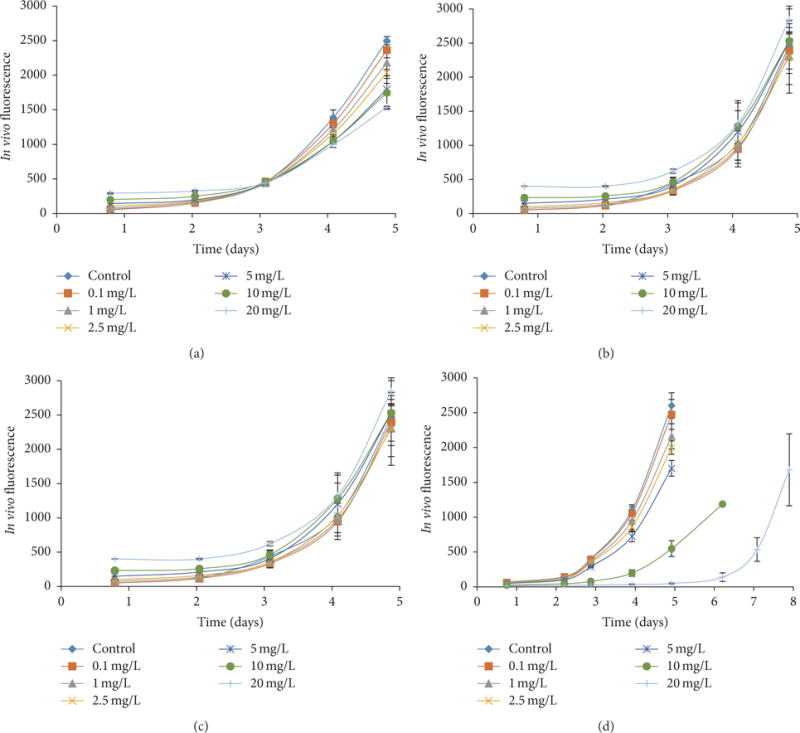
In vivo chlorophyll a fluorescence based growth curves of D. tertiolecta exposed to 0, 0.1, 1, 2.5, 5, 10, and 20 mg/L of samples: (a) f-SWCNT-A; (b) filtrate; (c) f- SWCNT-B; and (d) carbon black.

In vivo chlorophyll a fluorescence based growth curves of D. tertiolecta exposed to 0, 0.1, 1, 2.5, 5, 10, and 20 mg/L of samples: (a) f-SWCNT-A; (b) filtrate; (c) f- SWCNT-B; and (d) carbon black.