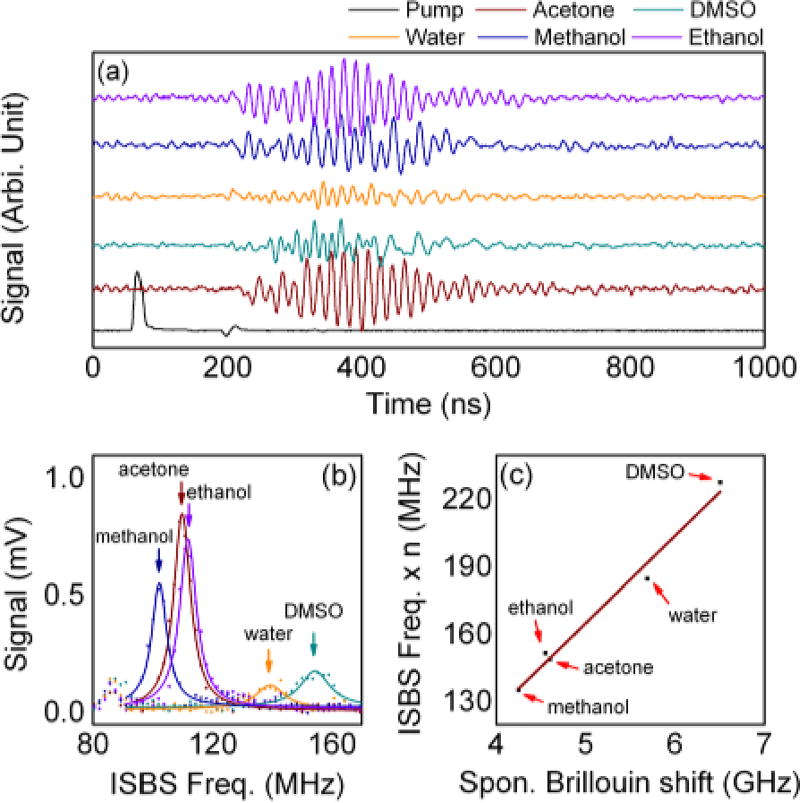
Fig. 2.
(a) The temporal relationship between the pump and the output probe intensities; (b) The results of the FFT analysis of the ISBS signal; (c) Correlation between the spontaneous Brillouin shifts and the ISBS frequency. The data for spontaneous Brillouin shift are taken from Boyd13.

