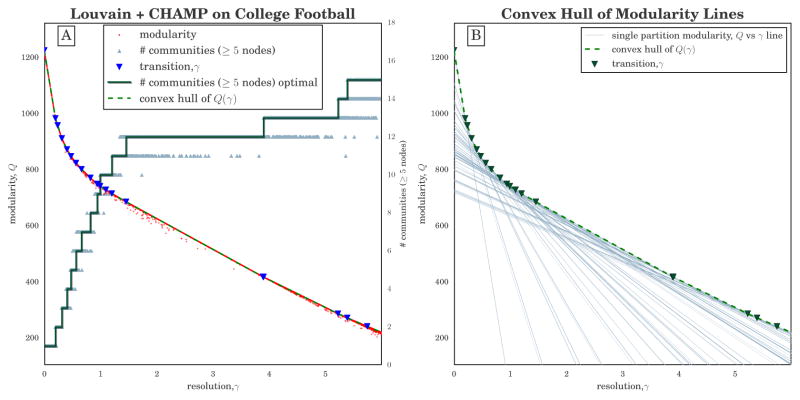
Figure 1.
(A) Modularity Q(γ) given by Equation (1) versus resolution parameter γ for 50, 000 runs (10% of results displayed here) of the Louvain algorithm [42,47] at different γ on the unweighted NCAA Division I-A (2000) college football network [37,38]. Grey triangles indicate the number of communities that include ≥ 5 nodes in each run, while the green step function shows the number in the optimal partition in each domain; (B) Graphical depiction of CHAMP algorithm (see Section 2). Each line indicates Qσ(γ) given by Equation (2) for a particular partition σ. Both panels show the convex hull of these lines as the dashed green piecewise-linear curve, with the transition values represented by downward triangles.

