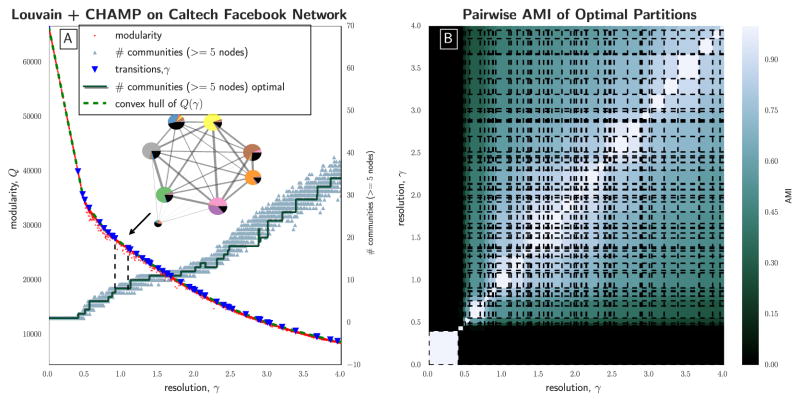
Figure 5.
(A) Modularity Q(γ) v. γ for 100, 000 runs (5% of results shown) of Louvain [42,47] on the Caltech Facebook network [31]. Orange triangles indicate the number of communities that include ≥ 5 nodes in each run, while the red step function shows the number in the optimal partition in each domain. The dashed green curve is the piecewise-linear modularity function for the optimal partitions, with the transition values marked by blue triangles. The condensed layout of communities (created with [53]) here visualizes the optimal partition found for γ ∈ [0.908, 1.09], with each pie-chart corresponding to a community, fractionally colored according to the House membership of the nodes in the community. The AMI between this partition and House labels (including the missing label) is 0.513; (B) Pairwise AMI between all partitions in the admissible subset identified by CHAMP, arranged by their corresponding γ-domains of optimality.

