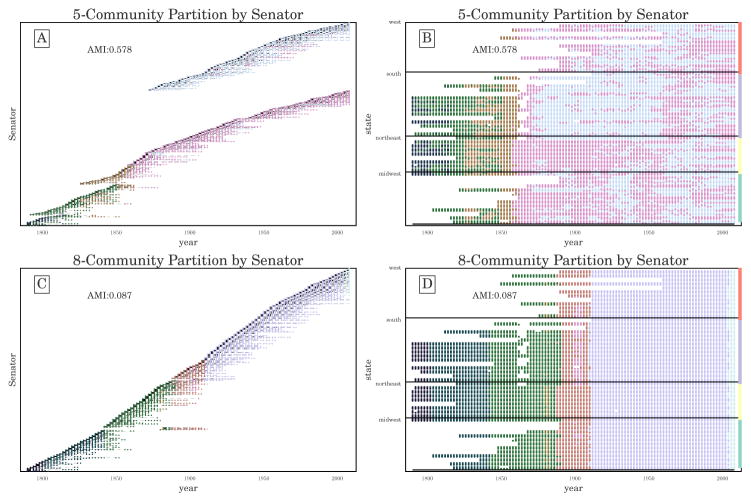
Figure 7.
Time-varying community structure for the U.S. Senate from 1789 to 2008 according to the (A,B) 5-community and (C,D) 8-community partitions with widest domains of optimality (see labels 5.1 and 8.1 in Figure 6A); (A,C) The vertical axis indicates individual Senators, sorted by community label and time. The AMI reported here is the average over layers (Congresses) of the AMIs in each layer between the identified communities in that layer and political party labels. (This layer-averaged AMI is shown for all partitions in the convex hull over the originally searched parameter range in Figure 8.) (B,D) The vertical axis indicates the state of a Senator, sorted according to geographic region, and the horizontal axis represents time (two-year Congresses).

