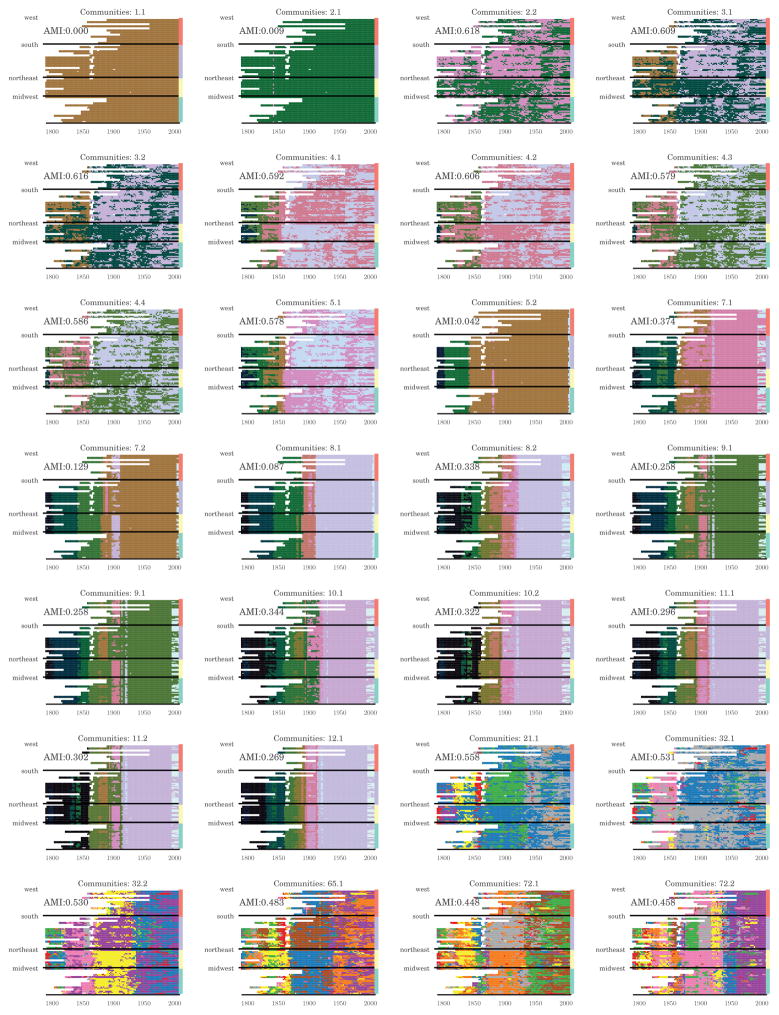
Figure A1.
Visualizations of partitions labeled in white in Figure 6A, with Senators grouped according to their state. The listed AMI is the average over layers of the AMI in each layer (Congress) between the communities and political party affiliations for that Congress. Partitions are labeled “X.Y” with X the number of communities with ≥ 5 nodes and Y the rank of the domain area for that number of communities

