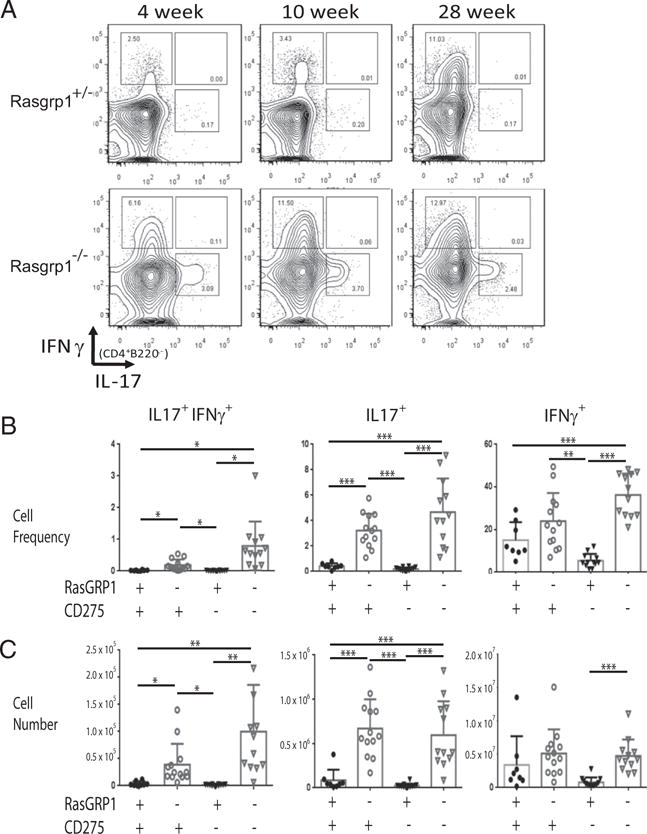
FIGURE 2.

Frequency and number of IFN-γ– and IL-17–producing CD4 T cells. (A) Splenic MNCs were gated on CD4 T cells, and the frequency of IFN-γ and IL-17 production was determined by intracellular staining. Shown are FACS plots for 4-week-old (left panels), 10-week-old (middle panels), and 28-wk-old (right panels) Rasgrp1+/− littermate control (upper panels) and Rasgrp1−/− (lower panels) mice. Data are a representative from one of five independent experiments. Summary of the frequencies (B) and numbers (C) of IFN-γ+ IL-17+ (left panels), Th17 (middle panels), and Th1 (right panels) CD4 T cell subsets from individual 10- to 12-wk-old Rasgpr1+/− (●), Rasgrp1−/− (○), ICOSL/CD275−/− (▼), and DKO (∇) mice. Each symbol represents an individual mouse (one-way ANOVA with Tukey’s multiple-comparison test, *p ≤ 0.01, **p ≤ 0.001, ***p ≤ 0.0001).
