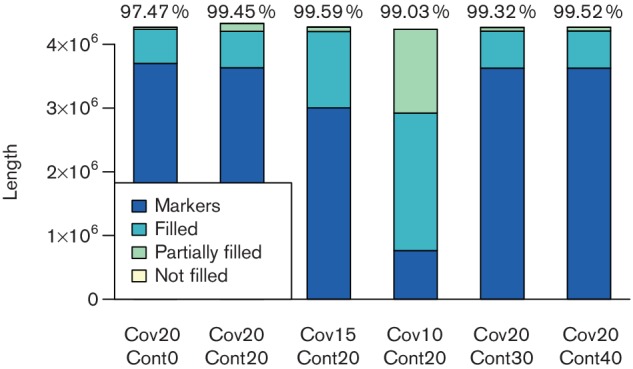
Fig. 3.

Length of reconstructed sequence defined by markers, completely filled gaps, partially filled gaps (only the covered parts are considered) and unfilled gaps. The simulation parameters vary in terms of read coverage (cov) and simulated bacterial contamination (cont). Above each bar, the percentage of the reconstructed sequence supported by the aDNA reads is given.
