Figure 3.

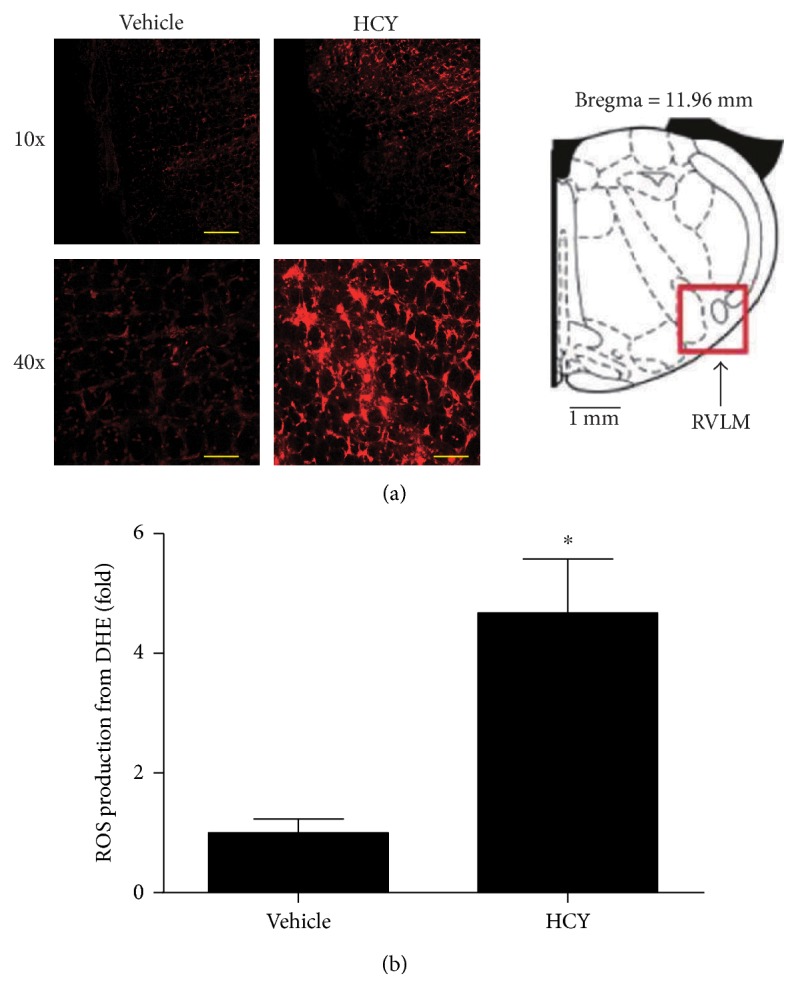
The ROS production in the RVLM in response to systemic HCY. (a) Representative images of ROS (red) by the DHE method in the RVLM region (right). Scale bars = 200 μm in 10x magnification and 50 μm in 40x magnification. (b) Quantification of ROS production in the RVLM. n = 5/group. ∗P < 0.05 versus the vehicle group.
