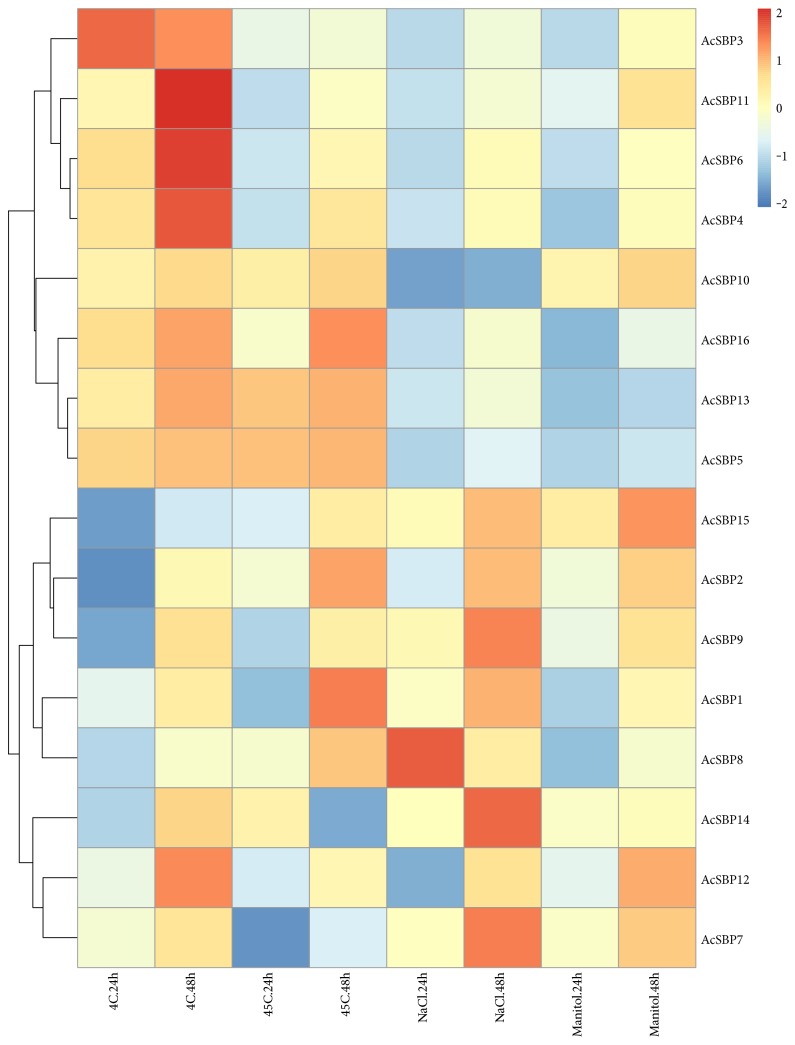
Figure 6.
A heat map of expression profiles of SBP genes under abiotic stresses [cold (4°C), heat (45°C), salt (NaCl), and drought (mannitol)]. qRT-PCR was used to analyze the relative expression level of each SBP gene. The expression level of pineapple actin was used as the internal control to standardize RNA samples for each reaction, and the expression at 0 h was taken as 1 (data not shown). Expression level can be understood using the given scale.

