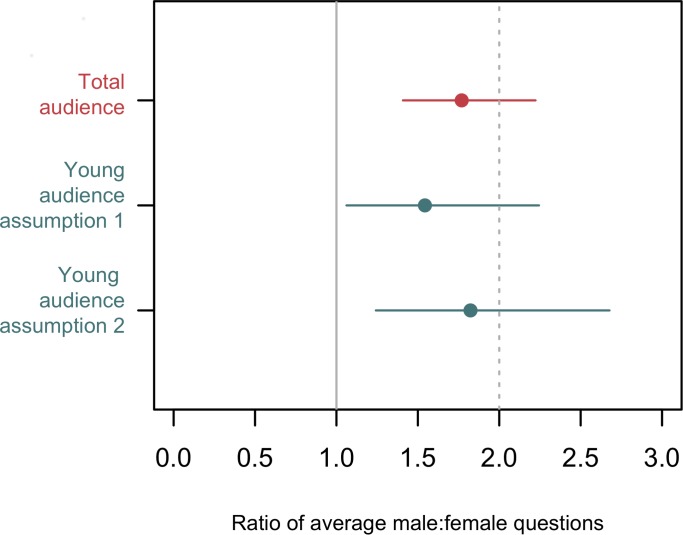
Fig 2. Estimated ratio of questions from male and female scientists.
The estimated ratio of male:female question rate estimated from the overall model and the two models with only those people judged to be under 50 years old. The grey lines indicate the point at which male audience members ask the same number of questions as female audience members (solid grey line) and twice as many questions (dashed grey line). The “<50 model observed proportion” is the model with the offset using the first assumption–that proportion of the younger audience that is male is the same as the observed proportion of the entire audience. This is likely to be an overestimate of the proportion of men in the younger age group, and the estimated ratio shown here will likely be negatively biased as a result. The “<50 model adjusted proportion” is the model with the offset using the second assumptions and adjusting the estimated proportion men and women in the younger audience to account for the fact that more senior researchers are male.

