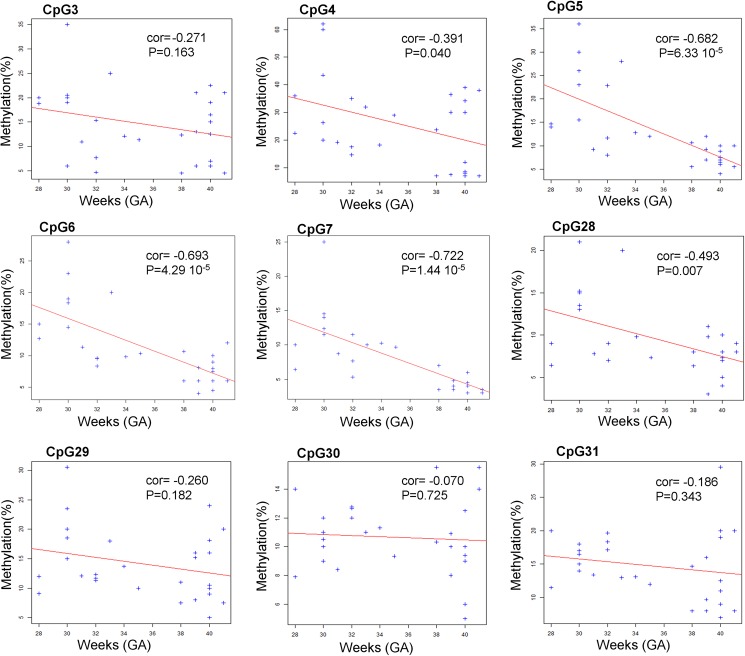
Fig 2. Correlation between methylation profile and gestational age.
Bisulphite pyrosequencing results for each CpG dinucleotide of the AMOT promoter CpG island. Dots represent methylation values (y-axis) at each CpG for the corresponding gestational age in weeks (x-axis). We used this two variables as quantitative to estimate the relationship. The "cor" value for each plot represents the Pearson correlation coefficient that estimates the link between the two variables and P-values correspond to statistical relevance of the "cor" coefficient. The red lines correspond to the linear regression of the methylation profile as function of gestational age to illustrate the correlation in the plot. A negative value of the cor coefficient corresponds to a deacreasing of the methylation as function of the gestational age for the linear model (decreasing red line). Statistical were performed using R statistical tools.

