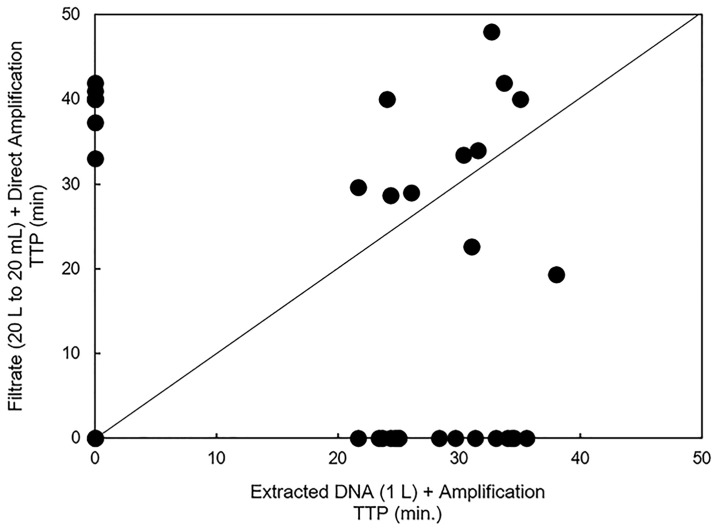
Fig 5. Comparison of results between the field-concentrated samples with direct amplification and the unconcentrated samples with DNA extraction and amplification.
This 1:1 plot shows amplification results of the field-concentrated samples with direct amplification as compared to the results of 1 L unconcentrated samples following DNA extraction. Points along the y-axis only amplified with the field-concentrated samples and direct amplification while those along the x-axis only amplified with the unconcentrated method. Points in the center correspond to positive detections using both methods.

