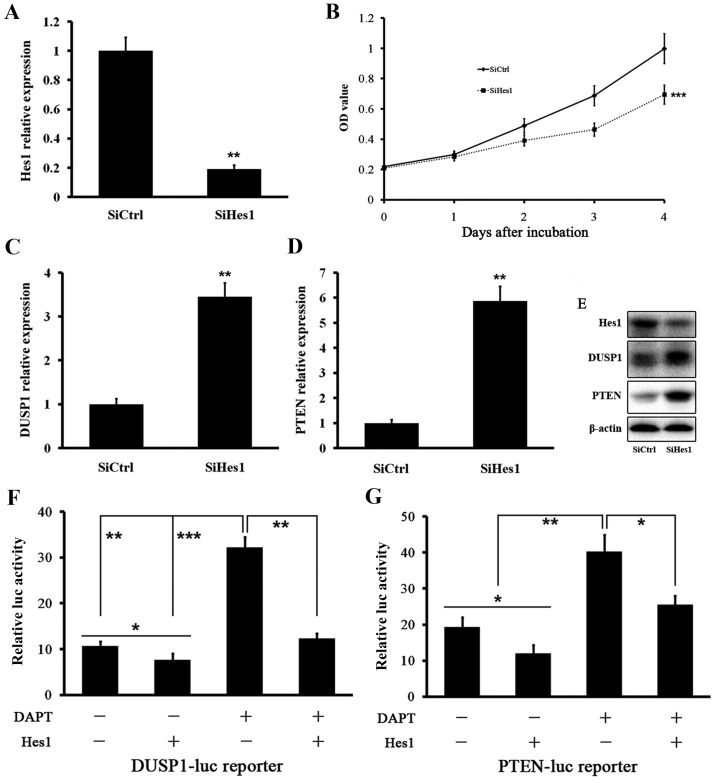
Figure 4.
Hes1 represses the expressions of DUSP1 and PTEN. (A) Hes1 mRNA level was effectively reduced after SiHes1. The changes were presented as fold change in comparison to the control. (B) Cell growth of HepG2.2.15 was inhibited after SiHes1. (C) DUSP1 mRNA level was increased after SiHes1. The changes were presented as fold change in comparison to the control. (D) PTEN mRNA level was increased after SiHes1. The changes were presented as fold change in comparison to the control. (E) Protein levels of DUSP1 and PTEN were increased after SiHes1. (F and G) Luciferase activity of HepG2.2.15 cells transfected with a DUSP1-luc reporter or PTEN-luc reporter together with a plasmid expressing HES1 or its corresponding empty control. Cells were treated with DAPT or its vehicle. Data were collected in at least three independent experiments. *P<0.05, **P<0.01, ***P<0.001.

