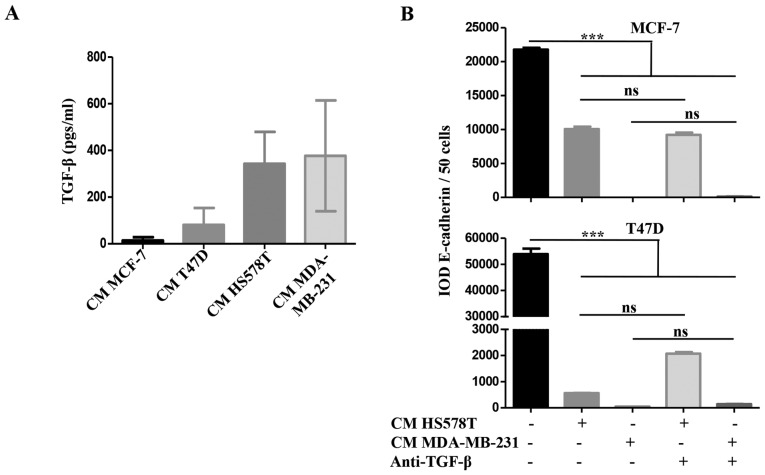
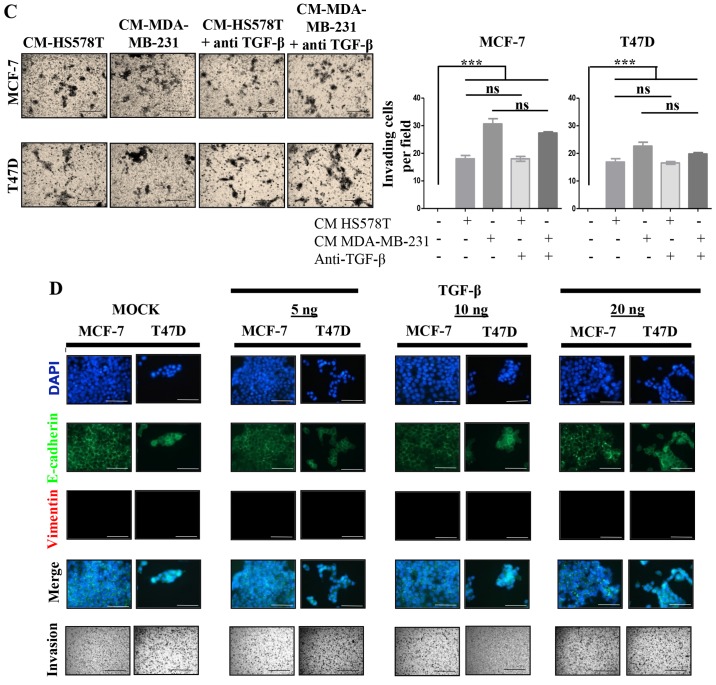
Figure 3.
The inducible-invasive phenotype is TGF-β independent. (A) The concentration expressed in pgs/ml of TGF-β was measured in the CM from all BrC cell lines and data were plotted. The inducible-invasive phenotype of MCF-7 and T47D cells was activated with HA-BrC CMs in the presence of 2 µg/ml of neutralizing anti-TGF-β. After 72 h of culture, (B) EMT markers were analyzed by IF and IODs of E-cadherin expression were quantified and plotted. (C) Invasion assays were performed. Left panels show representative images of invading cells and right plots show the number of invading cells. (D) Analysis of EMT markers and invasion assays of NA-BrC cell lines treated with increasing concentrations of TGF-β. Representative images are shown. Data represents the mean ± SEM from 3 independent experiments; ***P<0.001; ns, non-significant. Scale bars indicate 100 µm, magnification of ×400 for IF and ×100 for invasion assays.


