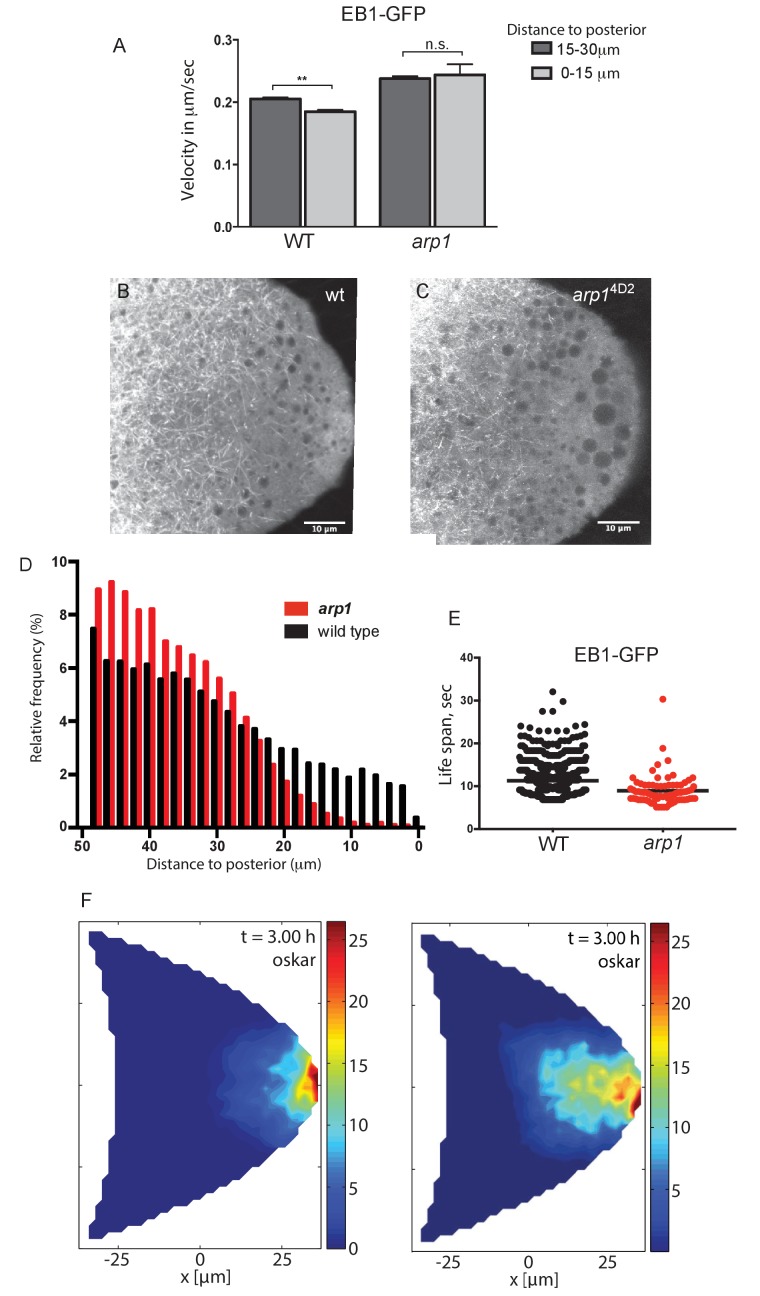
Figure 7. Dynactin is required for microtubule growth to the posterior cortex.
(A) A histogram showing the average velocities (µm/sec) of EB1 comets on growing microtubule plus ends in the centre of the oocyte (15–30 µm from the posterior) and near the posterior cortex (0–15 µm from the cortex) in wild-type (arp14D2/+) and arp14D2 homozygous oocytes. arp14D2/+: 3732 comets in the 15–30 µm region and 2068 comets in 0–15 µm region; arp14D2 homozygotes: 2815 comets in the 15–30 µm region and 221 comets in the 0–15 µm region. The plus ends slow down as they approach the posterior cortex in wild-type (p=0.007 by the paired t test), but fail to slow down in arp14D2, suggesting that the dynactin complex normally restricts the rate of microtubule growth in the posterior cytoplasm. Error bars indicate the SEM. (B–C) EB1 comet tracks in wild-type (B) and arp14D2 homozygous (C) oocytes. The images are merges of 40 frames from time-lapse movies taken at 1.7 s per frame. The tracks therefore represent the growth of microtubule plus ends over 68 s. (D) A histogram showing the relative frequency of EB1 comets at different distances from the posterior cortex in wild-type (black; arp14D2/+) and arp14D2 homozygous (red) oocytes. Very few microtubules extend within 10 μm of the posterior cortex in the arp14D2 mutant (n = 14440 for WT, n = 13062 for arp14D2, p<0.001 by the Wilcoxon rank-sum test). (E) A plot showing the lifespan of growing microtubule plus ends labelled by EB1-GFP near the posterior cortex (0–15 μm from the posterior) in wild type (n = 2058, mean = 11.29, SEM = 0.14) and arp14D2 homozygous oocytes (n = 211, mean = 8.94, SEM = 0.39). p<0.0001 by the unpaired t test. (F) Computer simulations of oskar mRNA transport with diffusion, motor-transport and cytoplasmic flows, showing the distribution of total cargo after three hours in cross section. The left hand panel (reproduced from Figure 3F of Khuc Trong et al. (2015) is a simulation in which the mean target length of the microtubules (ε) is set to 0.5 x the anterior-posterior length of the oocyte. The right panel shows an identical simulation in which the mean target length of the microtubules is reduced to 0.35. The shortening of the microtubules changes the simulated distribution of oskar mRNA from a tight posterior crescent to a more diffuse posterior cloud.


