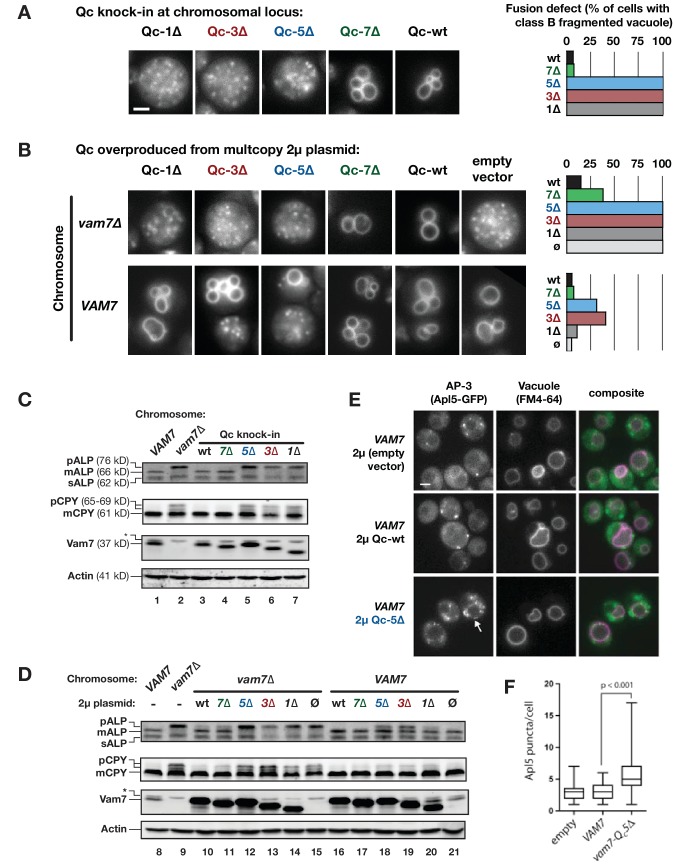
Figure 2. Characterization of Qc-∆ zippering mutants in vivo.
(A and B) Vacuoles were labeled by pulse-chase loading with the styryl dye FM4-64, and observed by wide-field epifluorescence microscopy. Defects in vacuole morphology are quantified in the graphs to the right. 106–411 cells of each genotype were scored in at least two independent experiments. (C and D) Cargo trafficking defects of Qc-∆ mutants. Cell lysates were prepared and separated by SDS-PAGE, then analyzed by immunoblot using polyclonal antibodies against Vam7 (Qc), or monoclonal antibodies against ALP or CPY. Polyclonal anti-actin was used for the loading controls. The slower-than-expected migration of Qc-5∆ was also observed with recombinant Qc-5∆ purified from E. coli cells. A non-specific band in the Vam seven blots was present in lysates from all strains including vam7∆ null mutants and is indicated by (*). (E and F) Overproduction of Qc-5∆ causes dominant partial accumulation of AP-3 vesicles. In some cells, the vacuole is not fragmented, and AP-3 vesicles (Apl5-GFP punctae) accumulate at the vacuole limiting membrane, as shown in panel E. In panel F, AP-3 vesicles are quantified (Mann-Witney U test; n = 100 cell profiles per strain in two independent experiments). Scale bars (A,B,E) indicate 2 µm.

