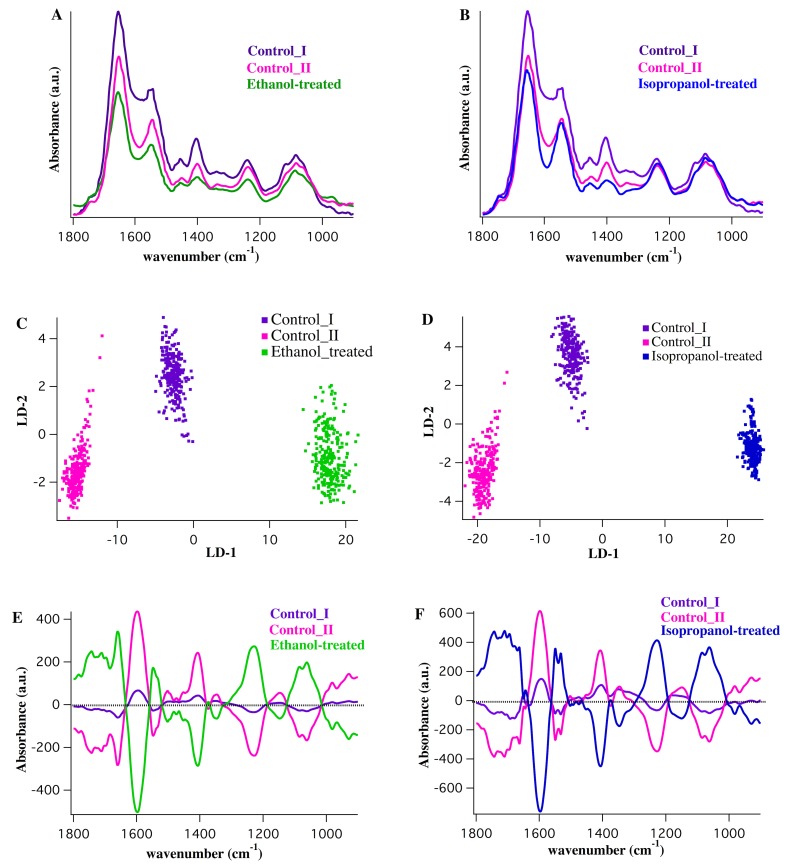
Fig 4. Comparison of the ethanol-treated and isopropanol-treated MRSA vs. control groups.
A,B) Average IR spectra from control I (purple), control II (pink), ethanol-treated (green) and isopropanol-treated (blue) MRSA. The spectra were averaged over nearly 40,000 individual IR spectra (64×64 pixels; 4096 spectra per measurement, 10 measurement per sample). C,D) Two-dimensional scores plot from PCA-LDA analysis (LD-2 vs. LD-1) derived from the comparison between control I, control II and ethanol-treated spectra (C) and between the controls and isopropanol-treated spectra (D). E,F) Corresponding cluster vector plot for the comparison made in C,D and the vector plot per cluster showing the significant discriminatory features, is shown.

