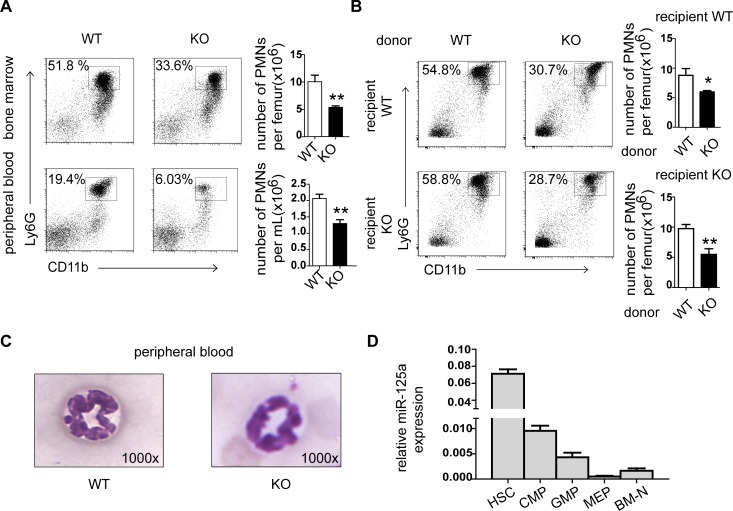
Fig 1. Decreased neutrophils in MiR125a-/- mice.
(A) Flow cytometry analysis of bone marrow (upper panel) and peripheral blood (lower panel). Neutrophils were stained with CD11b-Percp cy5.5 and Ly6G-APC. Bar graphs indicated numbers of neutrophils per femur. Values were represented as mean±s.d., n = 5 mice of each genotype. (B) Flow cytometry analysis of bone marrow neutrophils after bone marrow transplantation for 6 weeks. Bar graphs indicated total numbers of neutrophils. Values were represented as mean±s.d.,n = 5 mice of each genotype. (C) Morphological character of neutrophils in MiR125a+/+and MiR125a-/- mice. Peripheral blood (original magnification, x1000) of control and knockout mice were stained with Giemsa. (D) Expression of miR-125a during myeloid development (mean±s.d.,n = 3). HSC, hematopoietic stem cells; CMP, common myeloid progenitors; GMP, granulocyte–monocyte progenitors; MEP, megakaryocyte erythroid progenitors; BM-N, bonemarrow neutrophils. **P<0.01, *P<0.05(Student’s t-test).

