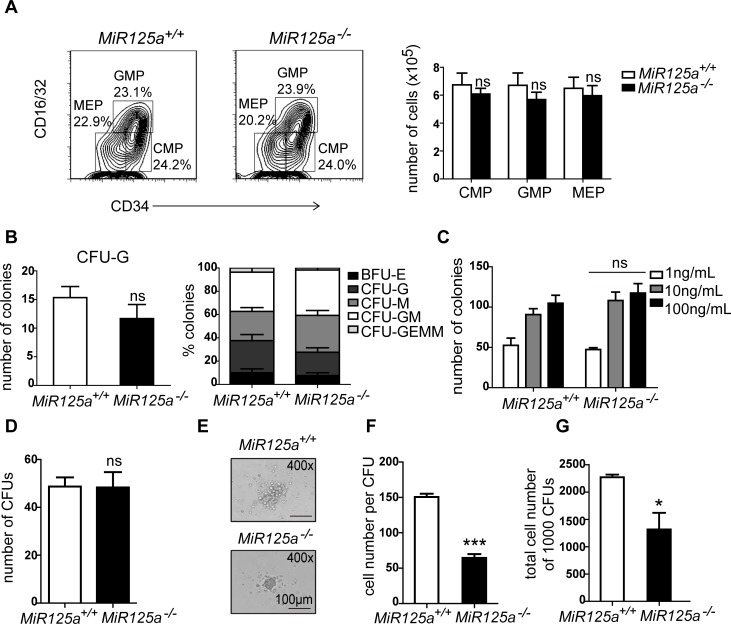
Fig 3. Impaired differentiation from granulocyte progenitors to mature neutrophils in MiR125a-/- mice.
(A) Flow cytometry analysis of myeloid precursor cell populations of 8-week-old mice. Plots shown here were previously gated on Lin-Sca-1-c-Kit+ cells. The right panel shows the overall number of precursors per bone marrow sample isolated from femurs and tibiae (mean±s.d.,n = 6 mice of each genotype). (B-C) Colony numbers of bone marrow cells in methylcellulose colony assays. Myeloid precursors were analyzed in complete methylcellulose medium containing SCF, IL-3, IL-6, and EPO (B) or varying concentrations of G-CSF (C). Values were represented as mean±s.d., n = 3 mice of each genotype. (D-G) 1000 GMPs were sorted from MiR125a+/+ or MiR125a-/- mice and cultivate in G-CSF containing methylcellulose media. Colony numbers (D), photographed CFUs (E), cell number per CFUs (F) and total cell number of 1000 CFUs (g) were shown. Values were represented as mean±s.d., n = 3 mice of each genotype. ns, none significant difference,*P<0.05, ***P<0.001(Student’s t-test).

