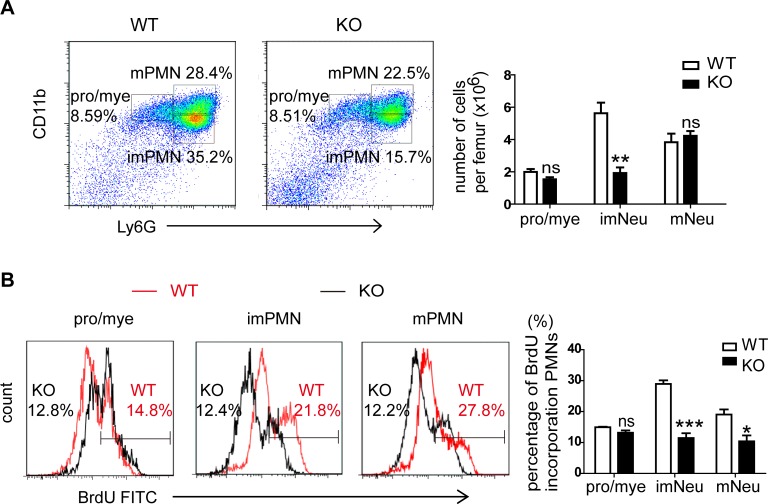
Fig 5. Decreased proliferation of immature neutrophils in MiR125a-/- mice.
(A) Flow cytometry analysis of three subpopulations in CD11b+Gr-1+ neutrophils in bone marrow. Mature neutrophils (mNeu) indicate CD11bhi Gr-1hi cells. Immature neutrophils (imNeu) indicate CD11blowGr-1hi cells and promyelocytes/myelocytes (pro/mye) indicate CD11bintGr-1int cells. The bar graph shows the average numbers of these subpopulations in MiR125a+/+ and MiR125a-/- mice. Values were represented as mean±s.d., n = 5 mice of each genotype. (B) Flow cytometry analysis of three populations of CD11b+Gr-1+ neutrophils incorporating BrdU in bone marrow after in vivo pulsing BrdU for 72 hours. The bar graph indicates the average percentage of intensities of BrdU-incorporating cells (mean±s.d., n = 5). Ns, none significant difference, *P<0.05, ***P<0.001 (Student’s t-test).

