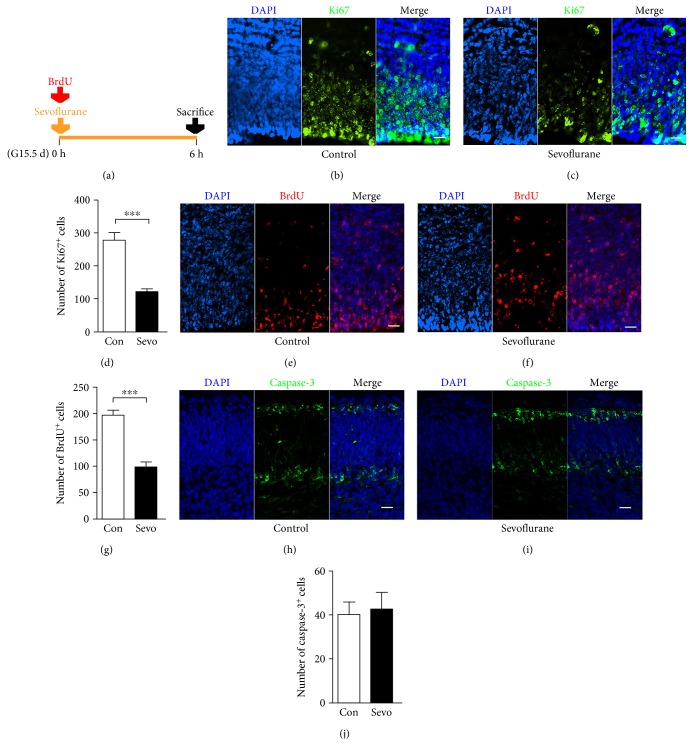
Figure 3.
Maternal sevoflurane exposure suppressed the proliferation of the fetal PFC. (a) Schematic diagram of the timing of sevoflurane exposure, BrdU injection, and sacrifice to assess the proliferation and apotosis of the fetal PFC. (b, c) Ki67 (green) immunofluorescence and DAPI staining (blue) in the cortical plate at G15.5. Scale bars, 20 μm. (d) Quantification of the Ki67+ cells of the control and sevoflurane groups. (e, f) BrdU (red) immunofluorescence and DAPI staining (blue) in the cortical plate at G15.5. Scale bars, 20 μm. (g) Quantification of the BrdU+ cells of the control and sevoflurane groups. (h, i) Caspase-3 (green) immunofluorescence and DAPI staining (blue) in the cortical plate at G15.5. Scale bars, 20 μm. (j) Quantification of the GFAP+ cells of the control and sevoflurane groups. Data are expressed as the mean ± SEM. ∗∗∗P < 0.001.

