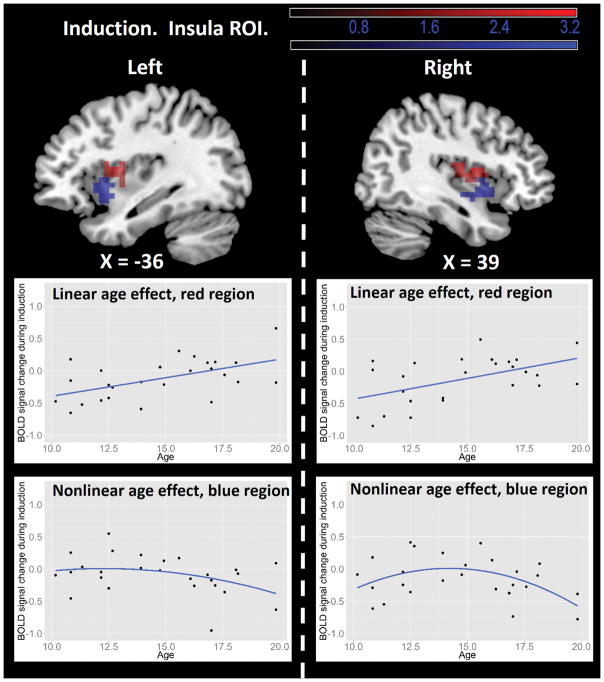
Figure 3.
Insular ROI results from the Regulation – Baseline contrast. Top panel: insula regions showing age effects. In both left and right hemispheres, the dorsal anterior insula (red regions) showed linear age effects, whereas the ventral anterior insula (blue regions) showed nonlinear age effects. The statistical threshold is set at a voxel-wise level of p < .05 and cluster size > 26. The dashed line separates results of left and right hemispheres. Middle panel: illustration of linear age effects in the dorsal anterior insula (red regions). Bottom panel: illustration of nonlinear age effects in the ventral anterior insula (blue regions). All scatter plots used average BOLD signal from the corresponding functional clusters and are for illustrative purposes only. Results are visualized on the Colin anatomical template in MNI space using MRIcron software (http://www.mricro.com/mricron/).

