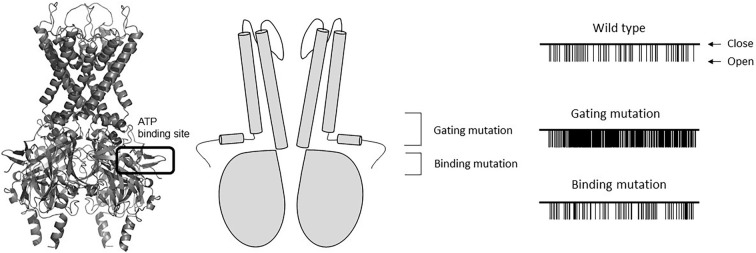
Figure 3.
A molecular model of Kir6.2 (left) and a simplified illustration of Kir6.2 (middle). ATP docks to its binding site. A schematic illustration of single KATP channel currents recorded at -60mV from inside-out patches with wild type or mutant Kir6.2 are shown on the right. Note that with the gating mutation, the Po increases in comparison to the wild-type channels. The increase in the Po is not observed with the binding mutation.

