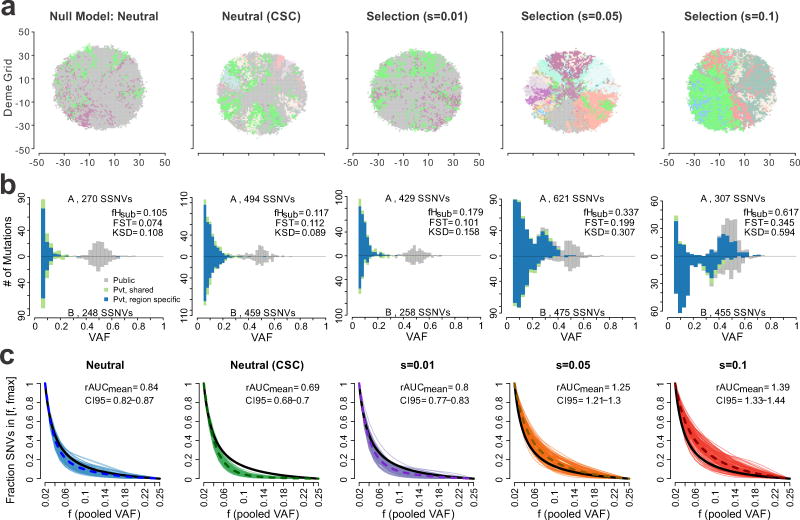
Figure 2. Characteristics of virtual tumors simulated under different modes of evolution.
(a) A 2D visualization of a clone map in virtual tumors simulated under different modes of evolution, including the null neutral model (selection coefficient, s=0), a neutral model with cancer stem cell driven growth (neutral-CSC), and varying levels of selection (s=0.01, 0.05 and 0.1). Colors correspond to distinct clones with high VAF (> 0.4) in each deme subpopulation. (b) Representative pairwise SFS histograms derived from two spatially separated regions (labeled A and B) within the same tumor are shown for tumors simulated under different evolutionary modes. SSNVs were classified as Public (gray), Private (Pvt)-shared (green), or Private-region specific (blue) based on their presence in the virtual MRS data (Methods). The total number of SSNVs detected in each region, as well as three ITH metrics are indicated, namely fHsub, FST, KSD. (c) The cumulative SFS derived from virtual tumors (100 shown for each mode) was computed based on the pooled VAF for subclonal SSNVs for four regions in the frequency (f) range 0.02–0.25. Curves are Bezier smoothed. The dashed curve corresponds to the average and the black curve to a theoretical cumulative SFS under neutral exponential growth in a well-mixed population. For each mode, the mean ratio of the area under the cumulative SFS from the virtual tumors compared to that of the theoretical cumulative SFS (denoted rAUC) based on 100 virtual tumors is indicated as are the 95% bootstrap confidence intervals.

