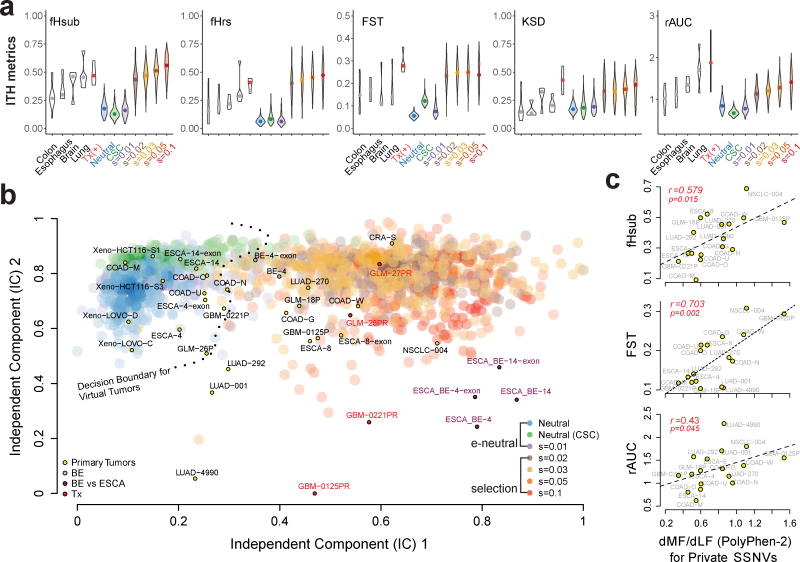
Figure 6. Projection of patient samples onto distinct evolutionary modes.
(a) Violin plots for each of five ITH metrics, namely, fHsub, fHrs, Fst, KSD, and rAUC. Colored violin plots show the virtual tumors simulated under different evolutionary modes, whereas the white plots correspond to patient tumor data. Paired pre-treatment primary and post-treatment recurrent brain tumors are denoted by “Tx” and serve as a positive control for selection. (b) Independent component analysis (ICA) of virtual and patient tumors based on the five ITH metrics. The independent components separate virtual tumors simulated under effectively (e) neutral growth (neutral, neutral-CSC and s=0.01) versus positive selection (s≥0.02) where the decision boundary for a SVM trained on two independent components (IC) based on the virtual tumors (e-neutral versus positive selection models) is indicated by the dashed line. Large transparent colored circles represent values from virtual tumors under different models (200 tumors from each of the seven modes are shown). Small circles indicate patient tumors labeled by their corresponding sample ID and color-coded according to the type of sample. COAD: colorectal adenocarcinoma; CRA: colorectal adenoma; ESCA: esophageal adenocarcinoma; BE: Barrett’s esophagus; LUAD: lung adenocarcinoma; NSCLC: non-small-cell lung cancer; GLM: glioma; GBM: glioblastoma; Xeno: COAD cell line xenografts. (c) The ratio of private SSNVs at more functional (MF) relative to less functional (LF) sites (dMF/dLF) based on PolyPhen2 was calculated for each of the primary tumors in order to evaluate the correlation with various ITH metrics.

