Figure 6.
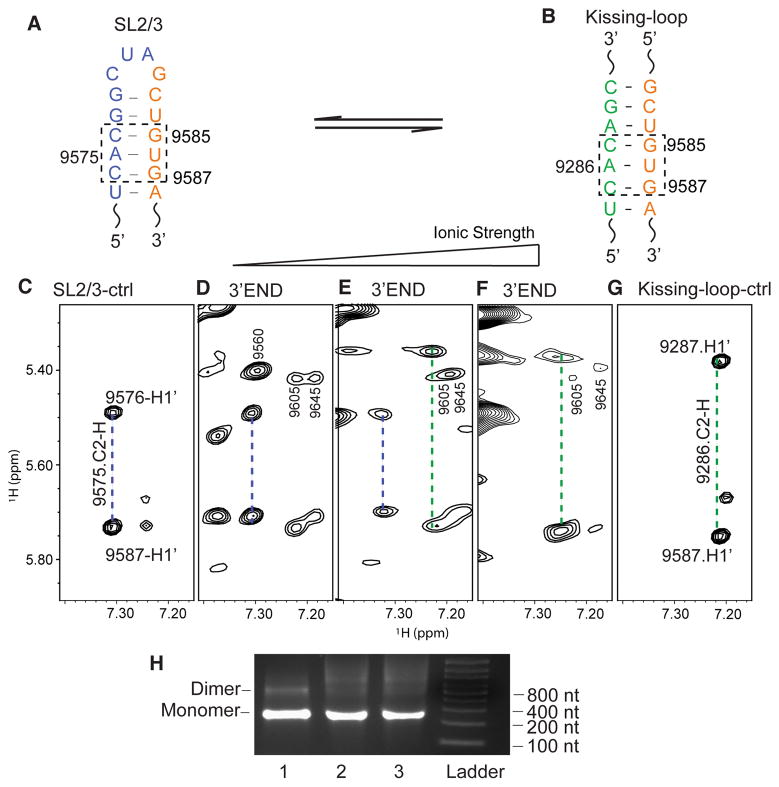
NMR detection of the 3′-end RNA structural equilibrium. (A) In the 3′-end open conformation, G9585UG9587 base pairs with C9574AC9576 in SL2/3 (dashed box). (B) In the 3′-end kissing-loop conformation, G9585UG9587 base pairs with C9285AC9287 in 5BSL3.2 (dashed box). (C) Portion of the SL2/3 control oligonucleotide NOESY spectrum showing that the C2-H of A9575 gives NOEs to H1′ of C9576 and G9587 (blue dashed line). (D–F) NOESY spectra of the 3′-end RNA in 10 mM Tris-HCl (D), PI buffer (E), and PI buffer containing 6 mM Mg2+ (F). (G) NOESY spectrum of the kissing-loop control oligonucleotides showing that the C2-H of A9286 gives NOEs to H1′ of C9287 and G9587 (green dashed line). (H) The 3′-end RNA remained monomeric under various buffer conditions: left lane, low-ionic strength buffer; middle lane, PI buffer; right lane, PI buffer containing 6 mM MgCl2.

