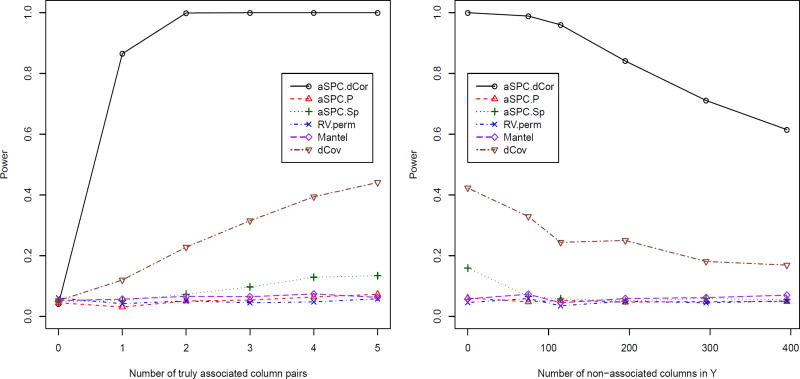
Figure 2.
Simulation II results. The left panel: when the number of columns in X and Y are 5, the empirical type I error and power curves of the tests as the number of truly non-linearly associated column pairs between X and Y ranges from 0 (type I error) to 5. Right panel: when the number of non-linearly associated column pairs in X and Y is fixed at 5, the power curves of the tests as more and more non-associated columns are added to Y. The nominal significance level is 0.05

