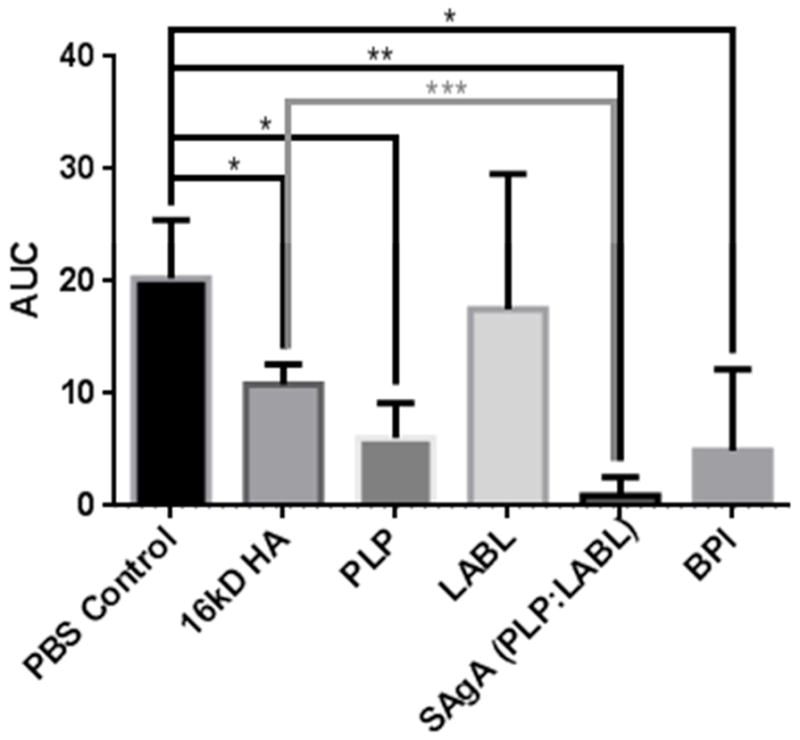
Figure 2.

Area under the curve (AUC) of clinical scores throughout the study from each of the 6 groups. Each group is the aggregate total of the scores from each of the 6 animals. A one-way ANOVA test showed significances between the PBS control group and other groups and SAgA-treated group and other groups. * p<0.05, ** p<0.01, *** p<0.001
