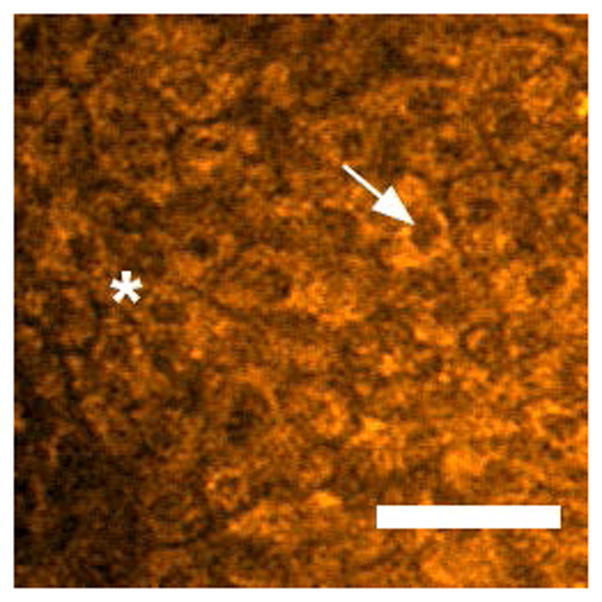
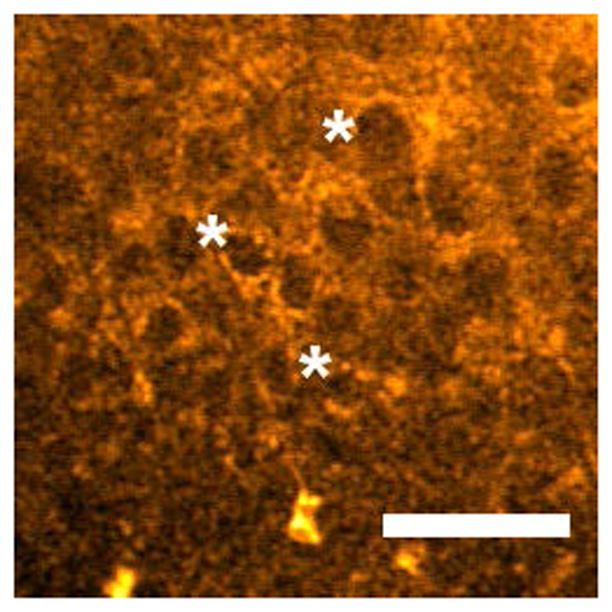
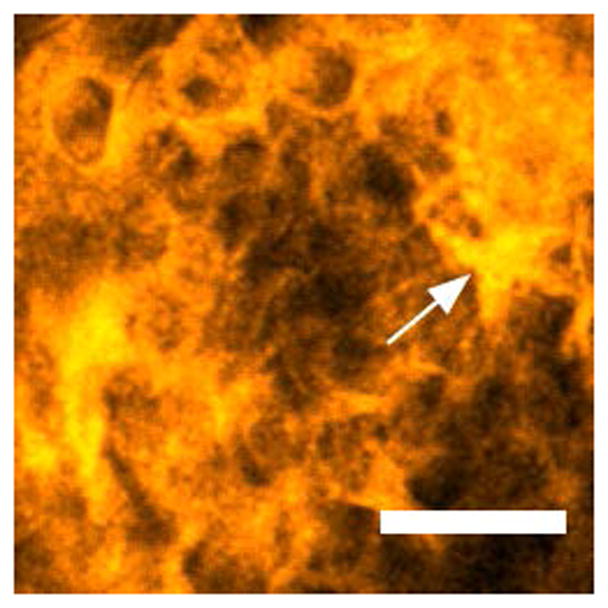
Figure 1.


Two-photon autofluorescence images of control (a), moderate OED (b), and OSCC (c) epithelium at 780 nm excitation. “*” and “→” in (a) indicates cytoplasm and nucleus respectively, and “*” in (b) indicates pleomorphic nuclei. “→” in (c) indicates premature keratinization. Scale bar: 50 μm.
