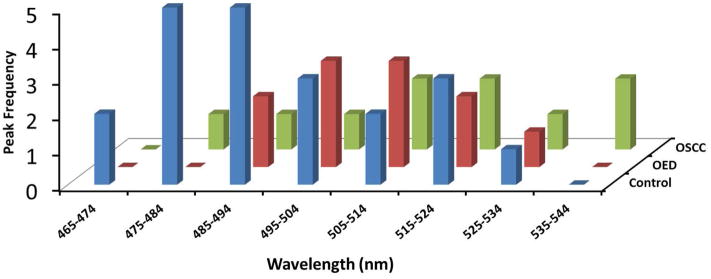
Figure 3.
Distribution of autofluorescence peaks in the 456 nm to 545 nm ranges is shown for control, OED and OSCC. Histograms indicate most samples in the control (blue) group showed a blue-green peak in lower wavelengths while in OED (red) and OSCC (green) showed a wider distribution of the blue-green peak, which was often in the longer wavelengths than control.

