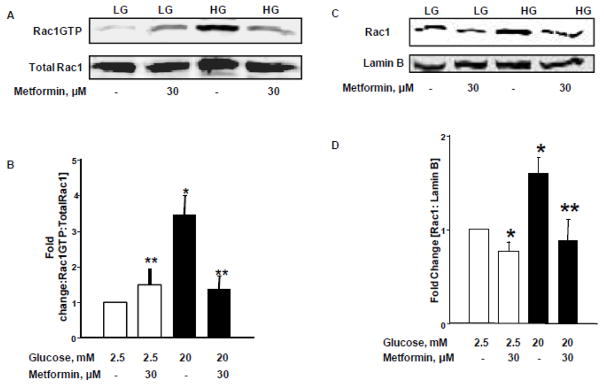
Figure 4. Metformin suppresses HG-induced Rac1 activation and nuclear association in INS-1 832/13 cells.
Panel A: INS-1 832/13 cells were cultured in LG [2.5mM] or HG [20mM] for 24 hours in the absence and presence of Metformin [30 μM]. Rac1 activation assay was performed using pull-down activation assay biochem kit [see Methods for additional details]. Cell lysates were separated by SDS-PAGE followed by Western blotting.
Panel B: Band intensities of Rac1 were quantified by densitometric analysis. Abundance of active Rac1 in pull-down samples was normalized by total Rac1. Pooled data from three experiments was represented in this panel. *p < 0.05 vs. 2.5mM glucose alone, **p < 0.05 vs. 20mM glucose alone.
Panels C and D: INS-1 832/13 cells were incubated with LG [2.5mM] and HG [20mM] in the absence and presence of metformin for 24 hrs. Cell lysates were analyzed for Rac1 by Western blotting. Purity of the nuclear fractions was verified by probing with Lamin B. Band intensities for Rac1 were measured using densitometry and the ratios were calculated over lamin B in the presence of metformin [n=3]. *p < 0.05 vs. 2.5 mM glucose alone, **p < 0.05 vs 20mM glucose alone.

