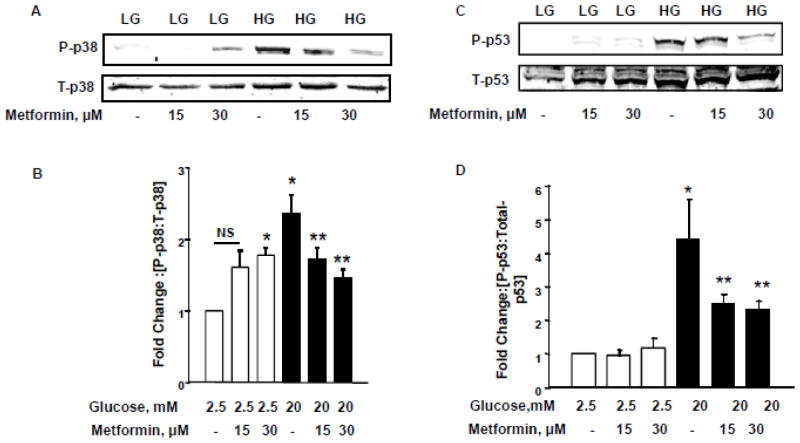
Figure 6. Metformin inhibits HG- induced p38MAPK and p53 activation in INS-1 832/13 cells.
Panel A: INS-1 832/13 cells were incubated with LG [2.5mM] and HG [20mM] in the presence and absence of metformin [0–30 μM] for 24 h. Relative abundance of phopho-p38MAPK and total-p38MAPK was determined by Western blotting.
Panel B: Quantification of the phopho-p38 bands was done by densitometry and the ratios were calculated over total-p38 in the presence of metformin [n=5]. *p < 0.05 vs 2.5mM glucose alone, **p < 0.05 vs 20mM glucose alone; NS: not significant.
Panel C: INS-1 832/13 cells were treated with LG [2.5mM] and HG [20mM] in the absence or presence of metformin [0–30 μM] for 24 h. Cell lysates were separated and analyzed for phosphorylated and total p53 by Western blotting.
Panel D: Band intensities for phospho-p53 were measured using densitometry and the ratios were calculated over total-p53 in the presence of metformin. *p < 0.05 vs 2.5mM glucose alone, **p < 0.05 vs 20mM glucose alone [n=3].

