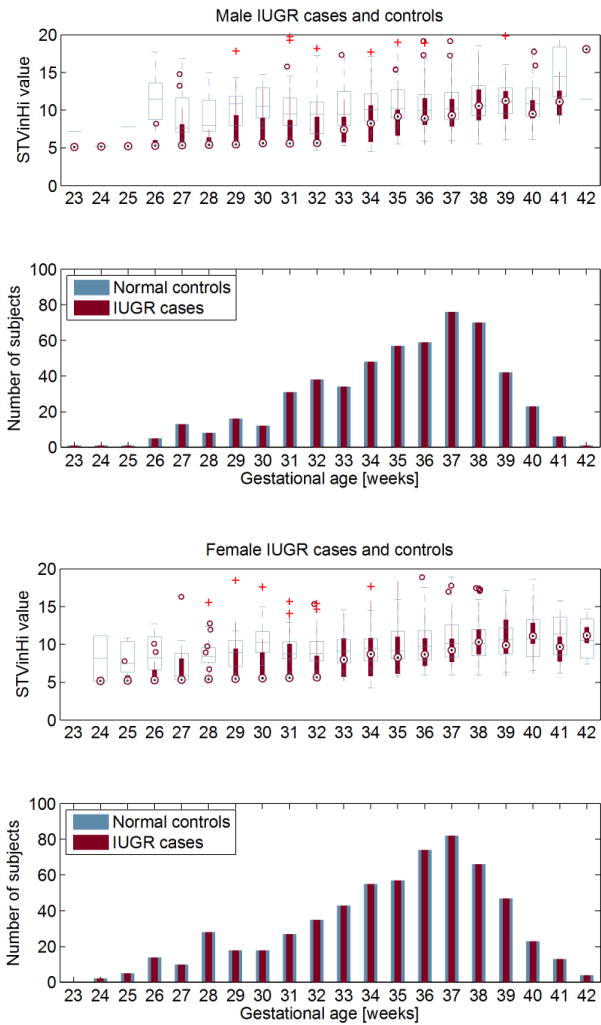
Figure 2.

Top graphs: The difference of STVinHi in the male (a) and female (b) IUGR population (red circles) compared to controls (white boxes). Bottom graphs: The number of male (a) and female (b) IUGR cases and controls in each gestational age group. Of all age groups with N >= 15 for both cases and controls the two male study populations differ significantly at 29 and 31 to 36 weeks (p < 0.05), the two female study populations differ significantly at 28, 30, 31, 32, 36 and 37 weeks (p < 0.05).
