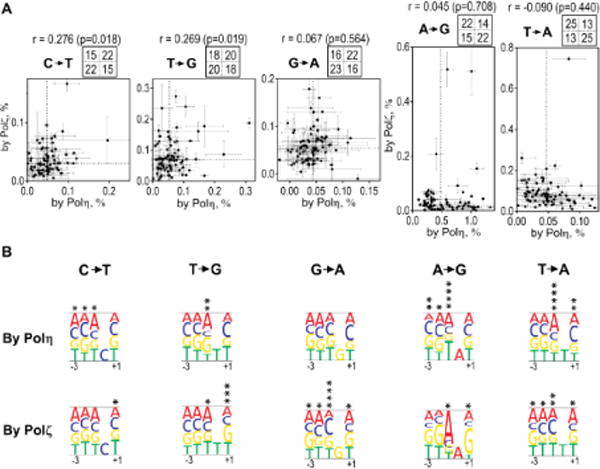
Fig. 4. Correlation of base-substitution frequencies created by Polη and Polζ on undamaged templates.

(A) Frequencies of indicated base-substitutions by Polη (x-axis) versus by Polζ (y-axis) at individual substitution sites are plotted. Error bars are SD (n=2–3). Dashed lines in the plotting area indicate medians, and numbers in four sections above each graph indicate the numbers of data points in corresponding sections in the plotting area. The value “r” is the Pearson correlation coefficient (with two-sided p values).
(B) Effects of the bases from 3-nt upstream to 1-nt downstream of the substitution on the substitution frequencies by each polymerase are expressed as heights of the letters, as in Fig. 3C.
