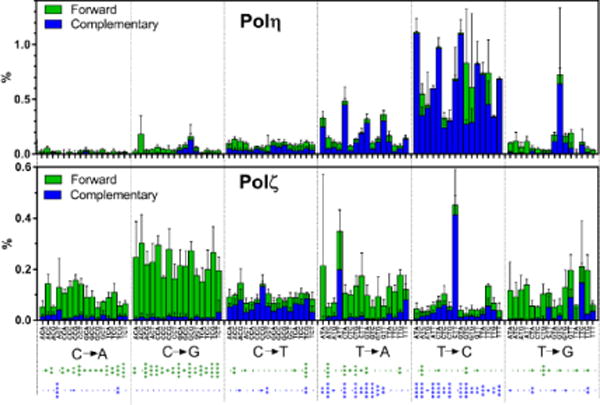
Fig. 6. Base-substitution signatures of Polη and Polζ on undamaged template in a three-base format.

Substitution frequencies of Polη and Polζ at the center of three-nucleotide sequences were calculated from the data presented in Fig. 2A and Supplemental Fig. S2. Frequencies of complementary changes are organized in the same columns in different colors. For example, “5′ATC→5′AGC” substitution and “5′GAT→5′GCT” substitution are complementary to each other, thus their frequencies are categorized in the “T → G” group and stacked in the single column (ATC) as green (forward) and blue (complementary) bars, respectively. Asterisks below the graphs indicate significance of difference in the two polymerases making forward (green asterisks) and complementary (blue asterisks) base-substitutions (*, **, ***, and **** indicate p<0.05, p<0.01, p<0.001, and p<0.0001, respectively).
