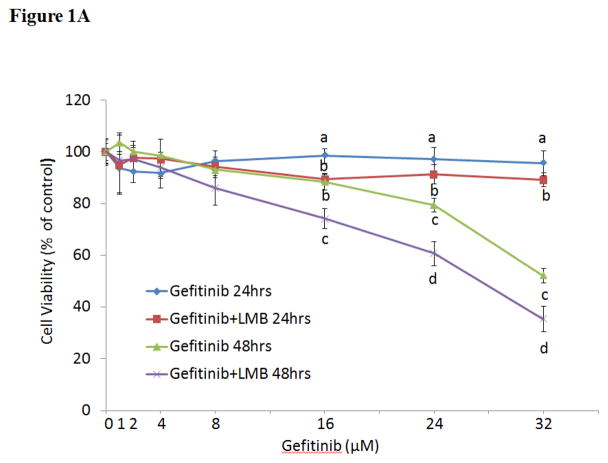
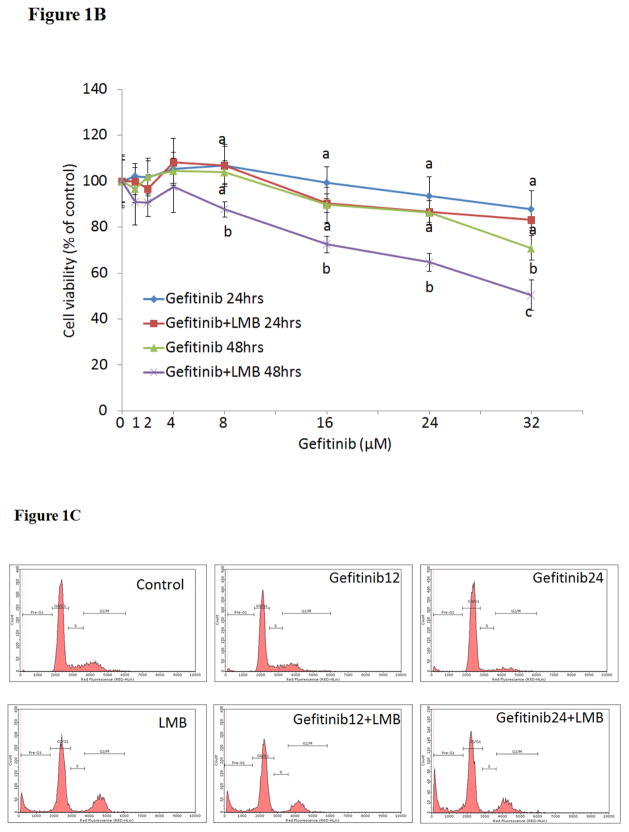
Figure 1. Cytotoxic effects of gefitinib and/or LMB on (A) A549 and (B) H460 and (C) flow cytometry analyses of cell cycle in A549 after gefitinib and/or LMB treatment.
Cytotoxic effects of gefitinib alone and gefitinib+LMB on the cell viability of A549 (A) and H460 (B) were determined by the MTT assays. Data are expressed as the percentage by comparing to vehicle controls for gefitinib treatments or LMB (0.5 nM) for gefitinib+LMB treatments. Values are represented as mean±SD, n= 6. Mean values at the same concentration containing different letters indicate a significant difference among the treatment groups analyzed by a one-way ANOVA followed by a Fisher’s LSD test (p<0.05). (C) Representative histograms of cell cycle analyses in gefitinib and LMB-treated A549 for 48 hrs were shown. Control, LMB, Gefitinib12, Gefitinib12+LMB, Gefitinib24, and Gefitinib24+LMB were harvested and labeled with Guava Cell Cycle Reagent (Millipore) and analyzed by flow cytometry (pre-G1, G0/G1, S, and G2/M). The y-axis shows the number of cells counted and the x-axis shows an increasing amount of Guava Cell Cycle Reagent incorporation/cell (left to right). Experiments performed in triplicate yielded similar results. LMB: 0.5 nM LMB, Gefitinib12: 12 μM gefitinib, and Gefitinib24: 24 μM gefitinib.


