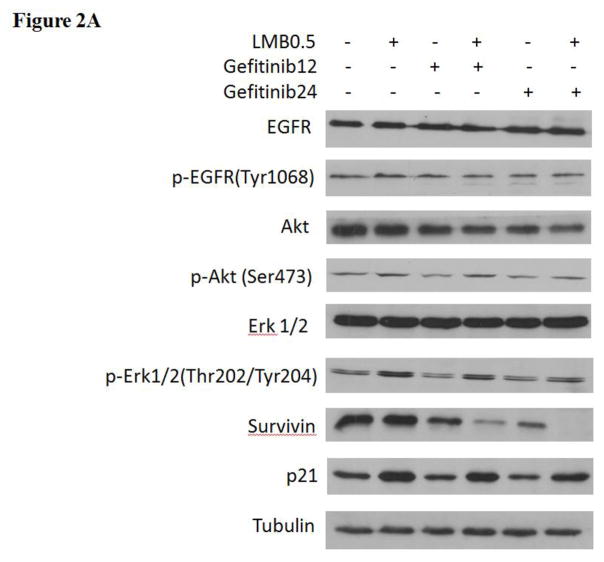
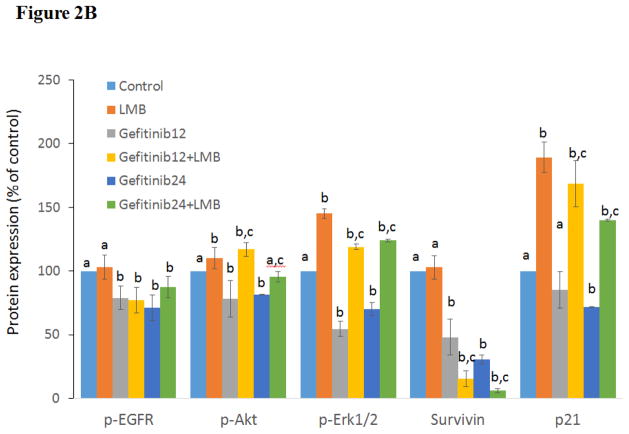
Figure 2. Western blot analyses of protein expressions in A549 after gefitinib and/or LMB treatment.
(A) Effects of gefitinib+LMB treatment on the protein expression of EGFR, p-EGFR(Tyr1068), Akt, p-Akt(Ser473), Erk1/2, p-Erk1/2(Thr202/Tyr204), survivin, and p21. After 48 hrs treatment, cells were harvested for Western blot analysis to determine protein levels. Blots were also probed for α-tubulin to confirm equal protein loading. (B) The relative protein intensities of p-EGFR(Tyr1068), p-Akt(Ser473), p-Erk1/2(Thr202/Tyr204), survivin, and p21 as compared to the control after normalized by the intensity of α-tubulin. The intensity of each band was quantified using ImageJ software. Data are means±SD, n= 3. Mean values of the same protein containing different letters indicates a significant difference among the treatment groups analyzed by a one-way ANOVA followed by a Fisher’s LSD test (p<0.05). Values bearing the letter “a” indicate no significant differences compared with control, those labeled “b” denote a significant difference when compared with the control, and “c” denotes a significant difference when gefitinib+LMB is compared with gefitinib alone. LMB: 0.5 nM LMB, Gefitinib12: 12 μM gefitinib, and Gefitinib24: 24 μM gefitinib.


