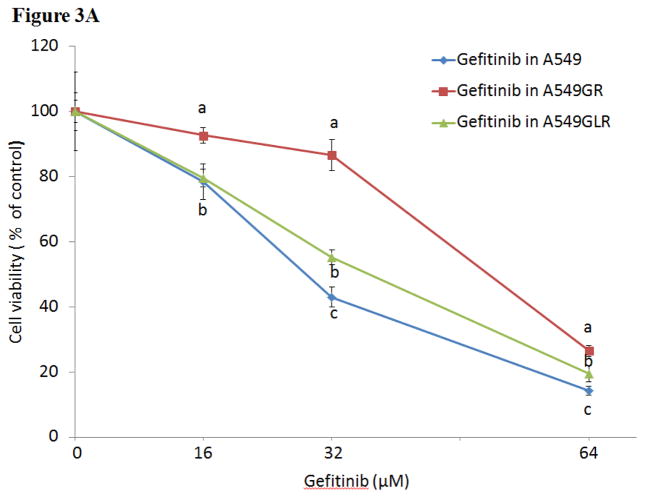
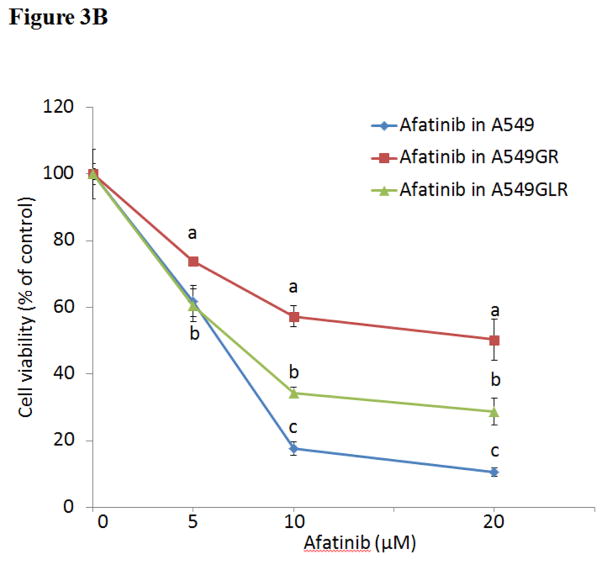
Figure 3. Cytotoxic effects of (A) gefitinib or (B) afatinib on A549, A549GR, and A549GLR.
Cytotoxic effects of gefitinib or afatinib on the cell viability of A549, A549GR, and A549GLR were determined by the MTT assay. Data are expressed as the percentage by comparing to vehicle controls. Values are represented as mean±SD, n= 6. Mean values at the same concentration containing different letters indicate a significant difference among the treatment groups analyzed by a one-way ANOVA followed by a Fisher’s LSD test (p<0.05).


