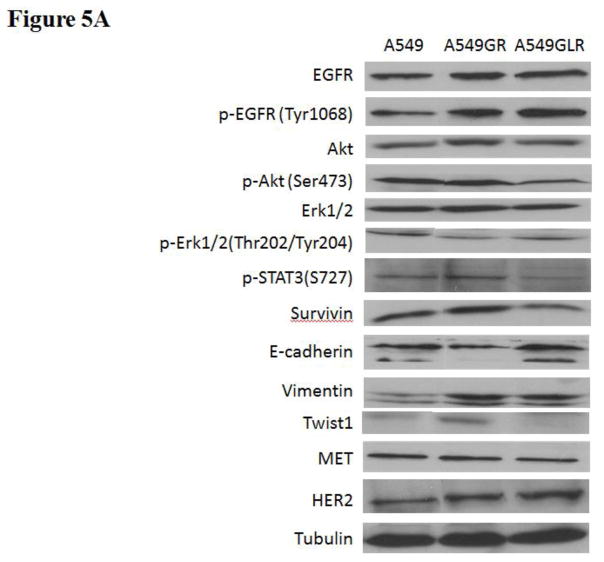
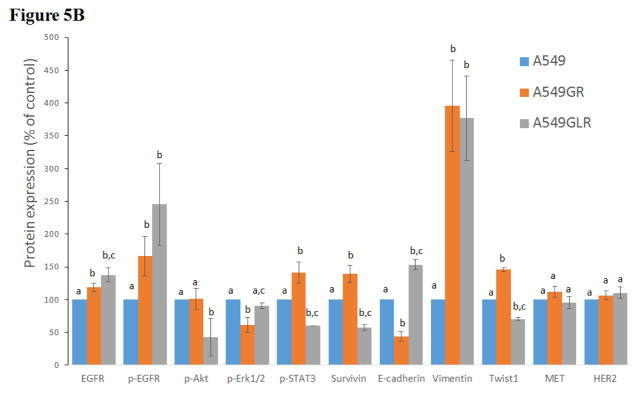
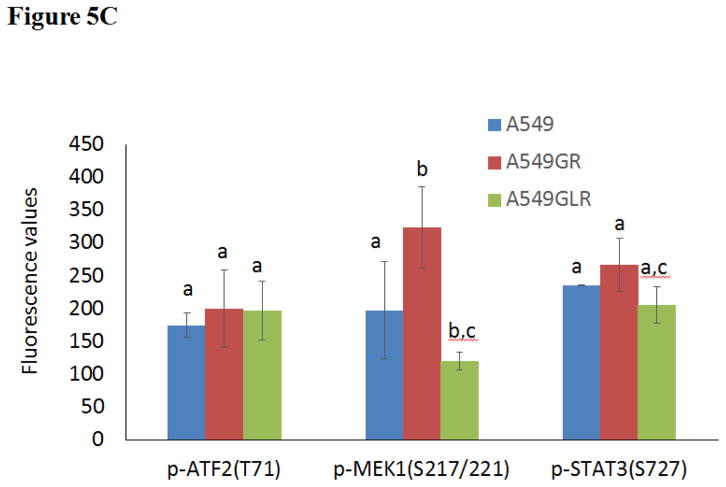
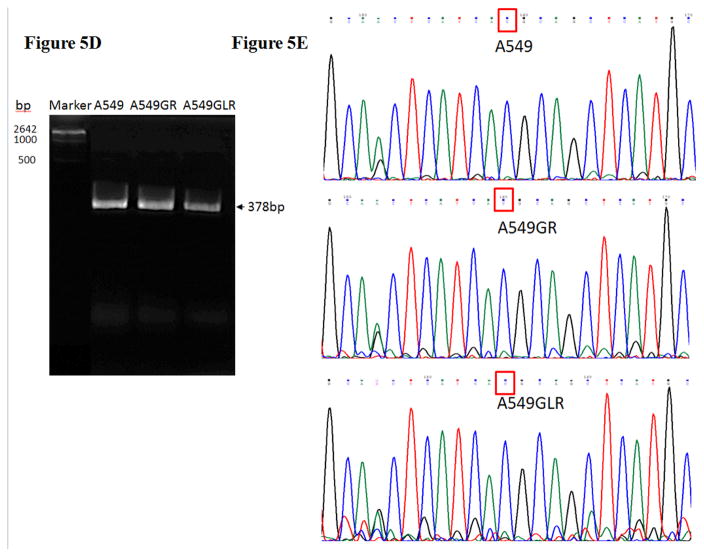
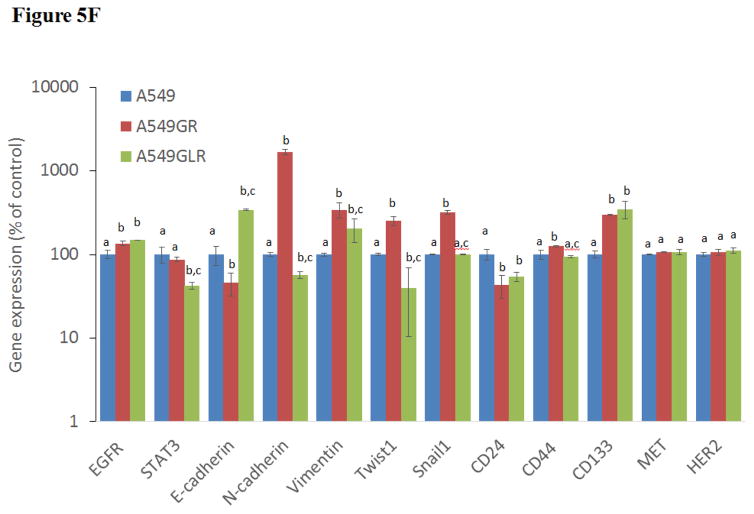
Figure 5. Protein and gene analyses in A549, A549GR, and A549GLR.
(A) Protein expressions of EGFR, p-EGFR(Tyr1068), Akt, p-Akt(Ser473), Erk1/2, p-Erk1/2(Thr202/Tyr204), p-STAT3(S727), survivin, E-cadherin, vimentin, Twist1, MET, and HER2. Blots were also probed for α-tubulin to confirm equal protein loading. (B) The relative protein intensities of EGFR, p-EGFR(Tyr1068), p-Akt(Ser473), p-Erk1/2(Thr202/Tyr204), p-STAT3(S727), survivin, E-cadherin, vimentin, Twist1, MET, and HER2 as compared to A549 after normalized by the intensity of α-tubulin. The intensity of each band was quantified using ImageJ software. Data are means±SD, n= 3. (C) Bio-Plex multiplex immunoassay for detections of p-ATF2, p-MEK1, and p-STAT3 in A549, A549GR, and A549GLR. (D) 2% agarose gels shows 378bp bands of EGFR exon 20 PCR products amplified from A549, A549GR, and A549GLR. (E) DNA sequencing for EGFR exon 20 of A549, A549GR, and A549GLR. The typical EGFR TKI resistant T790M mutations (c.2369C>T) were not found in exon 20 of either A549GR or A549GLR. (F) qRT-PCR analysis of EGFR, STAT3, E-cadherin, N-cadherin, vimentin, Twist1, Snail1, CD24, CD44, CD133, MET, and HER2 in A549, A549GR, and A549GLR. Data are represented as mean±SD, n=3. Mean values of the same protein or the same gene containing different letters indicate significant differences among the treatment groups analyzed by a one-way ANOVA followed by a Fisher’s LSD test (p<0.05). Values bearing the letter “a” indicate no significant differences compared with A549, those labeled “b” denote a significant difference when compared with A549, and “c” denotes a significant difference when A549 GLR is compared with A549GR.

