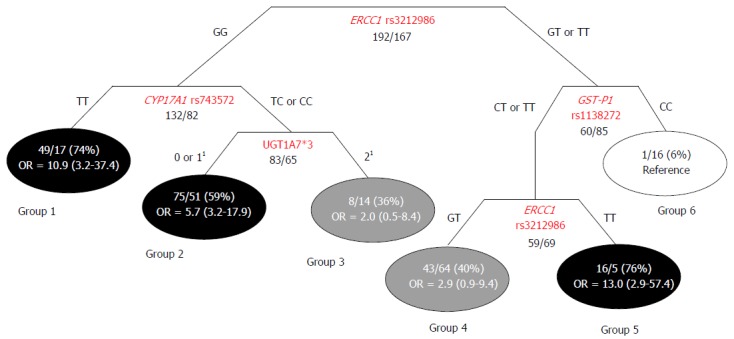
Figure 1.

Classification and regression tree representation of the markers combination significantly predictive of hepatocellular carcinoma risk. Fractions indicate the number of HCC cases patients vs number of HBV/HCV infected patients (percentage of cases in parenthesis). Black circles represent terminal nodes with high probability to develop hepatocellular carcinoma (HCC) (ratio ≥ 70%); gray circles represent terminal nodes with intermediate probability to develop HCC (30 ≤ ratio < 70%); white circles represent terminal nodes with low probability to develop HCC (ratio < 30%). Odds ratios (OR) and 95%CI were calculated for each group in respect to the reference group (lower HCC risk) through logistic regression model, adjusted for sex, age and viral status. 1Number of alleles carried by the patient. CART: Classification and regression tree; HCC: Hepatocellular carcinoma; HBV: Hepatitis B viral; HCV: Hepatitis C viral.
