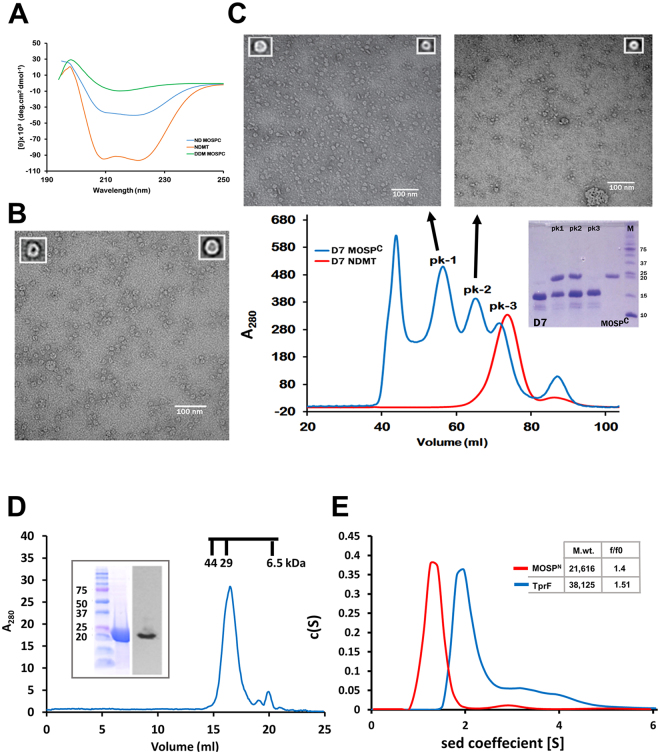
Figure 2.
MOSPC forms trimers capable of inserting into bilayer nanodics while MOSPN forms an extended hydrophilic structure. (A) CD spectra of MOSPC refolded in 1% DDM (green), empty E3D1 nanodiscs (orange), and MOSPC encapsulated in E3D1 discs (blue). (B) Negatively-stained TEM image of MOSPC in E3D1 discs with representative averaged images of an inserted monomer and trimer shown as insets in upper left and right, respectively. (C) Chromatogram of MOSPC incorporated into small D7 discs separated by SEC on a S200 column (blue). The chromatogram in red represents empty discs run separately as a control. The SDS-PAGE gel above the chromatogram shows the contents of peaks 1 through 3; lanes 1 and 5 contain D7 and MOSPC for reference, while lane 6 contains molecular mass markers (kDa). Above the chromatograms are TEM images of peaks 1 and 2 with insets containing representative averaged images. Peak 1 contains trimers and monomers, while peak 2 contains only monomers. (D) SEC of refolded recombinant MOSPN with SDS-PAGE and immunoblot shown as inset. Chromatographic molecular weight standards are shown above the major peak containing MOSPN. (E) Sedimentation velocity experiments performed on MOSPN and TprF using AUC. The inset shows the buoyant molecular masses and frictional coefficient ratios (f/fo) as determined through c(S) analysis using SEDFIT.

