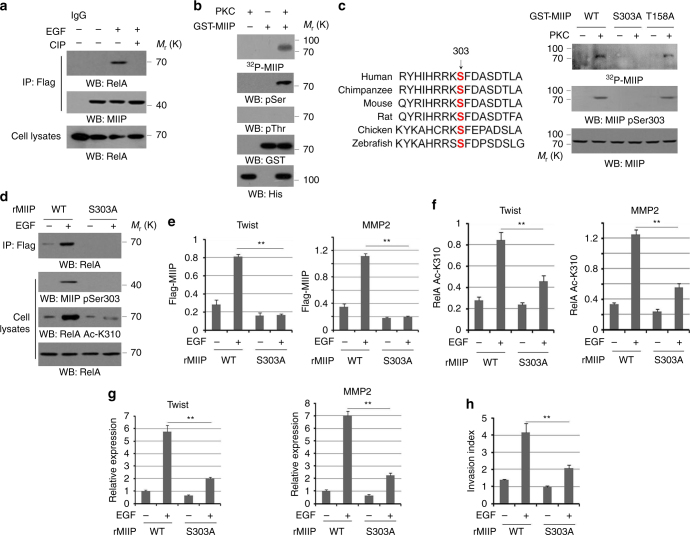
Fig. 2.
PKCε phosphorylated MIIP and promoted MIIP–RelA interaction. a HCT116 cells were treated with or without EGF. Cellular extracts subjected to immunoprecipitation with an anti-Flag antibody. The immunoprecipitates were treated with CIP (10 units), followed by immunoblotting analysis. b, c In vitro phosphorylation analyses were performed by mixing the purified active PKCε with the indicated purified GST-MIIP proteins in the presence of [γ-32P]ATP. Ser303 of MIIP is evolutionarily conserved in the indicated species (c, left panel). d HCT116 cells expressed with WT MIIP or MIIP S303A were treated with or without EGF for 30 min. e HCT116 cells expressed with WT MIIP or MIIP S303A were treated with or without EGF (100 ng/ml) for 10 h. f HCT116 cells with depletion of MIIP, and reconstituted expression of WT rMIIP or rMIIP S303A were treated with or without EGF (100 ng/ml) for 10 h. g HCT116 cells with depletion of MIIP, and reconstituted expression of WT rMIIP or rMIIP S303A were treated with or without EGF for 10 h. Relative mRNA levels were analyzed by q-PCR. h HCT116 cells with depletion of MIIP, and reconstituted expression of WT rMIIP or rMIIP S303A were treated with or without EGF (100 ng/ml). Cell invasion assays were performed. In e, f, ChIP analyses with indicated antibodies were performed. The primers covering RelA binding site of MMP2 gene promoter region were used for the q-PCR. The Y axis shows the value normalized to the input. In a–d, immunoblotting analyses were performed using the indicated antibodies. In e–h, the values are presented as mean ± s.e.m. (n = 3 independent experiments), ** represents P < 0.01 (Student’s t-test) between the indicated groups

