Fig. 3.
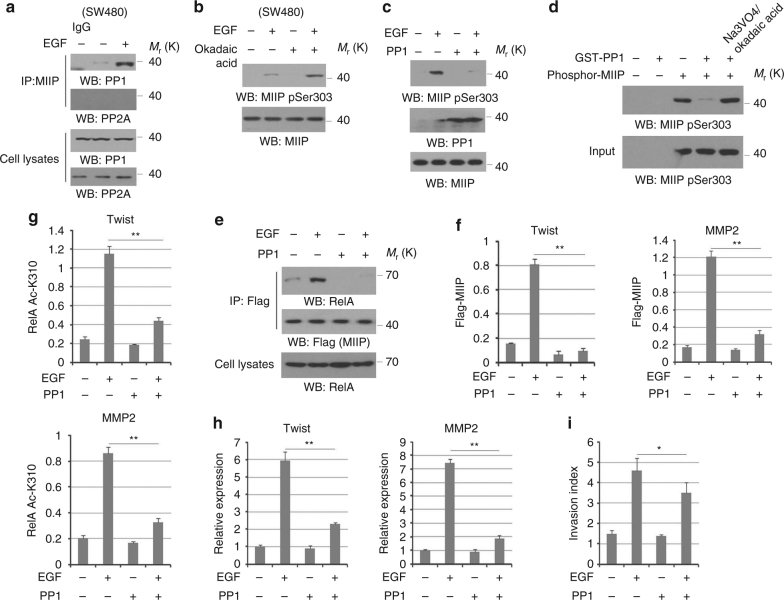
PP1 mediates MIIP dephosphorylation. a SW480 cells were treated with or without EGF. Cellular extracts subjected to immunoprecipitation with an anti-MIIP. b SW480 cells pretreated with Okadaic acid (a PP1 and PP2A inhibitor) (30 nM) were stimulated with or without EGF (100 ng/ml) for 30 min. c HCT116 cells transfected with or without plasmid for expressing PP1 were treated with or without EGF (100 ng/ml) for 30 min. d In vitro dephosphorylation analyses were performed by mixing the purified active PP1 with PKCε-phosphorylated GST-MIIP proteins in absence or presence of Na3VO4/Okadaic acid. e–h HCT116 cells expressing Flag-MIIP were transfected with or without plasmid for expressing PP1. Cells were treated with or without EGF (100 ng/ml) for 10 h. Cellular extracts subjected to immunoprecipitation with an anti-MIIP (e). ChIP analyses were performed. The primers covering RelA binding site of Twist or MMP2 gene promoter region were used for the q-PCR (f, g). Relative mRNA levels were analyzed by q-PCR (h). (i) HCT116 cells transfected with or without plasmid for expressing PP1 was treated with or without EGF (100 ng/ml). Cell invasion assays were performed. In f, g, ChIP analyses with indicated antibodies were performed. The primers covering RelA binding site of MMP2 gene promoter region were used for the q-PCR. The Y axis shows the value normalized to the input. In a–e, immunoblotting analyses were performed using the indicated antibodies. In a–e, immunoblotting analyses were performed using the indicated antibodies and data represent one out of three experiments. In g, f–i, the values are presented as mean ± s.e.m. (n = 3 independent experiments), * represents P < 0.05 and ** represents P < 0.01 (Student’s t-test) between the indicated groups

