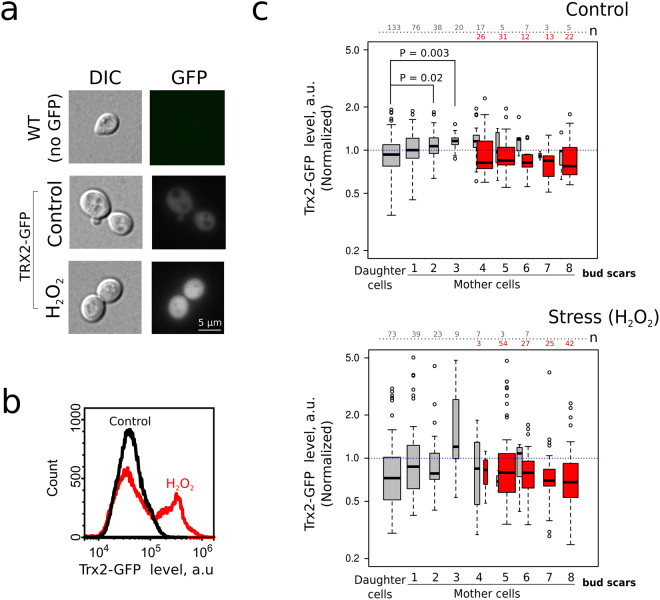
Figure 3.
Trx2-GFP level displays mother-daughter asymmetry but does not differ between the mother cells of different ages. (a) Representative photograph of control yeast cells and yeast cells expressing Trx2-GFP. Treatment of yeast cells with H2O2 (2 mM) induces an increase of Trx2-GFP levels; (b) Analysis of Trx2-GFP levels by flow cytometry under the control conditions and in the presence of 2 mM H2O2; (c) Quantification of Trx2-GFP in yeast cells of different age cohorts under the control conditions (upper panel) or treated with H2O2. Red box plots indicate Trx2-GFP levels in TRITC-ConA positive (age > 4 enriched) mother cells. The numbers of analyzed cells for each age class are shown at the top of the boxplot. The bin size for TRITC+ and TRITC− cells are designated separately. The only detected difference was between the untreated daughter and the mother cells (*P < 0.05; **P < 0.005 according to Nemenyi test).

