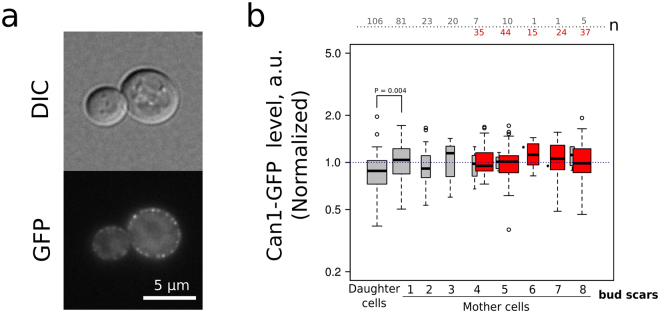
Figure 5.
The level of Can1-GFP does not differ in the mother cells aging cohorts. (a) Representative photograph of the control yeast cells expressing Can1-GFP. (b) Can1-GFP levels in the individual cells of different replicative age cohorts (n = 410 cells). Grey boxplots represent the random samples of yeast cells, the red box plot represents TRITC+ (age > 4 enriched) mother cells. The numbers of analyzed cells for each age class are shown at the top of the boxplot. The bin size for TRITC+ and TRITC− cells are designated separately. P value was calculated according Nemenyi-Test.

