Figure 6.
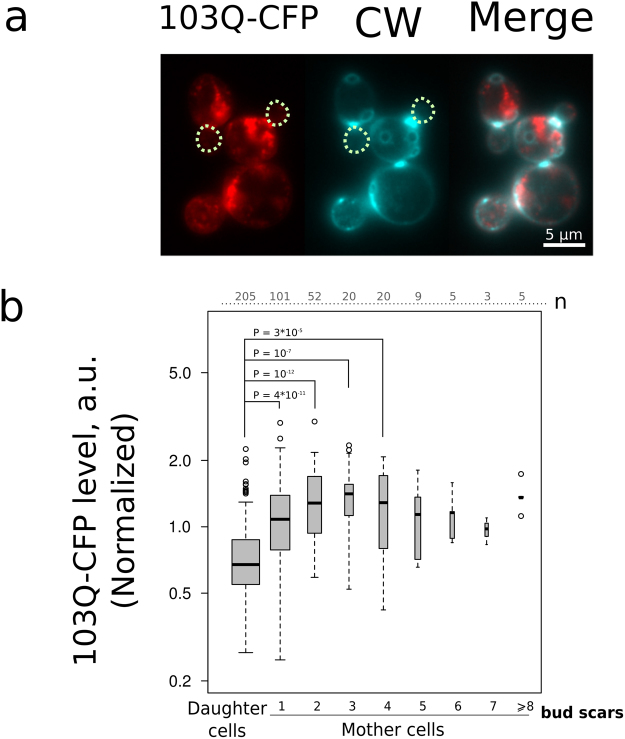
103Q-CFP level displays mother-daughter asymmetry. (a) Representative photograph of the group of cells expressing 103Q-CFP (red) stained with calcofluor white (blue). Image was generated by pseudo colouring: CFP-channel black and white image was copied to R channel, CW-channel image — to G and B channels of the RGB file. The dotted circles mark daughter cells. (b) Quantification of the average 103Q-CFP levels for replicative age cohorts. The numbers of analyzed cells for each age class are shown at the top of the boxplot. P value was calculated by Nemenyi-Test.

